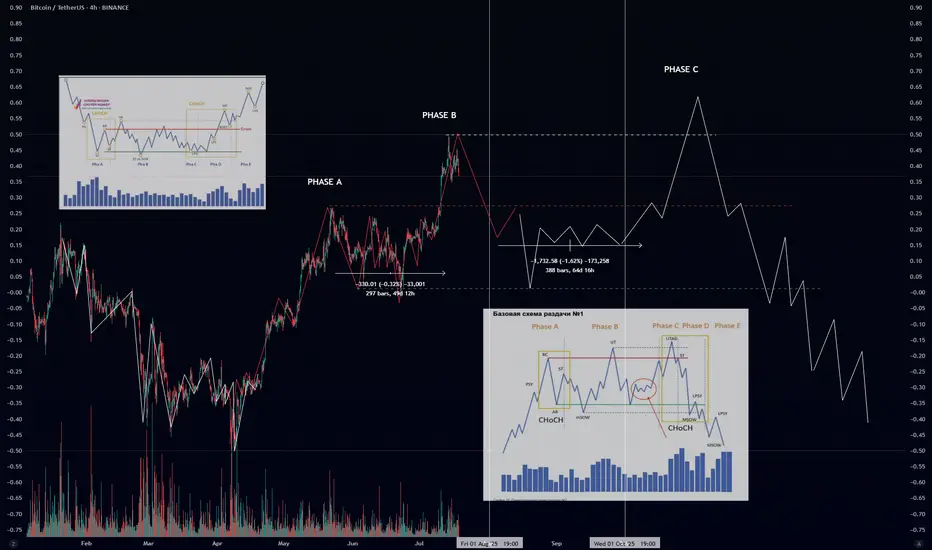
If you’ve ever wondered how smart money offloads their positions before a major downtrend — this is it. The Wyckoff Distribution Schematic #1 is the mirror opposite of accumulation. It reveals how institutions distribute (sell) to retail before the market collapses.
🔍 Phases Breakdown:
🟠 Phase A – Preliminary Supply & Buying Climax
PSY (Preliminary Supply): First signs of selling pressure.
BC (Buying Climax): Sudden surge in price with high volume – often traps late buyers.
AR (Automatic Reaction): Price drops as buyers lose momentum.
ST (Secondary Test): Retest of the top – often with lower volume.
🔄 CHoCH (Change of Character): Early warning sign that supply is increasing.
🟡 Phase B – Building the Cause
Sideways price action where large players distribute their holdings.
UT (Upthrust): Fake breakout above resistance.
mSOW (Minor Sign of Weakness): Slight breakdowns showing cracks in structure.
🔴 Phase C – The Trap
UTAD (Upthrust After Distribution): Final fakeout to trap bulls before the real drop.
Market often shows strength… right before the collapse.
Another CHoCH confirms the shift toward bearish control.
🔵 Phase D – Breakdown Begins
LPSY (Last Point of Supply): Final bounces with weak demand.
MSOW (Major Sign of Weakness): Strong breakdown on high volume — momentum shifts decisively.
⚫ Phase E – Downtrend
Distribution complete.
Price trends downward with weak rallies.
Retaiя is left holding the bag.
📊 Volume matters: look for volume spikes on upthrusts and breakdowns, and declining volume on bounces.
🔁 Compare with Accumulation:
Accumulation ends in Spring → Uptrend 📈
Distribution ends in UTAD → Downtrend 📉
Declinazione di responsabilità
Le informazioni ed i contenuti pubblicati non costituiscono in alcun modo una sollecitazione ad investire o ad operare nei mercati finanziari. Non sono inoltre fornite o supportate da TradingView. Maggiori dettagli nelle Condizioni d'uso.
Declinazione di responsabilità
Le informazioni ed i contenuti pubblicati non costituiscono in alcun modo una sollecitazione ad investire o ad operare nei mercati finanziari. Non sono inoltre fornite o supportate da TradingView. Maggiori dettagli nelle Condizioni d'uso.