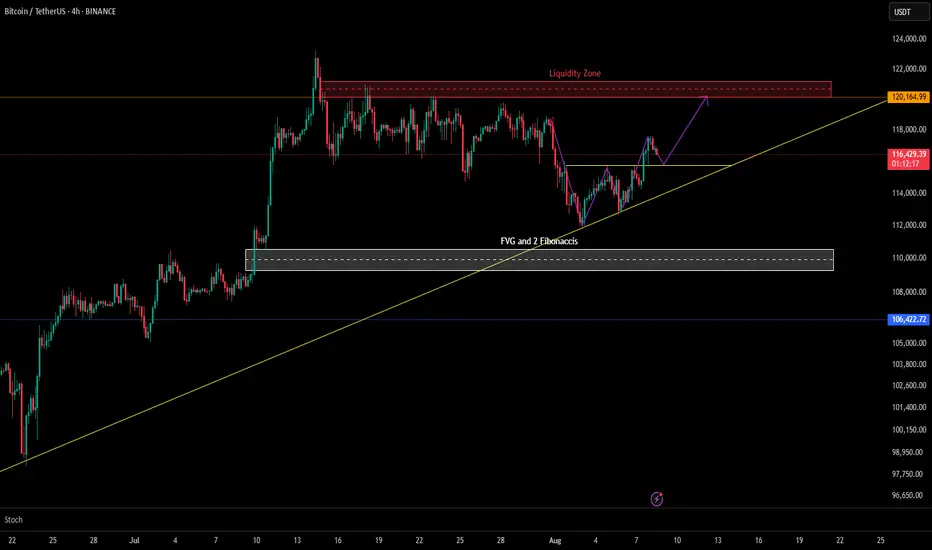
On the Daily timeframe, BTC is consolidating under a major Liquidity Zone with a strong FVG + Fibonacci confluence below price.
Now, zooming into the 4H chart, we can see the structure more clearly:
🔹 Liquidity Zone (~$120K) – Marked in red, this area is likely loaded with buy stops from shorts. A push into it could be a classic liquidity grab before any reversal.
🔹 FVG + Dual Fibonacci Confluence (~$109K) – Marked in grey, this zone remains a high-probability demand area if price pulls back.
🔹 Bullish Structure – Price has been respecting the ascending yellow trendline. The recent bounce suggests bulls could target the liquidity zone before deciding the next move.
Possible Scenarios:
✅ Bullish Path: Hold above trendline → Push toward $120K liquidity zone.
🔁 Bearish Path: Break of trendline → Deeper retrace into the FVG/Fib confluence zone.
Bias: Short-term bullish unless trendline breaks. Watching $120K for reaction.
Note: This 4H view builds directly on my recent daily chart post for BTC, giving a zoomed-in perspective for shorter-term traders.
Declinazione di responsabilità
Le informazioni ed i contenuti pubblicati non costituiscono in alcun modo una sollecitazione ad investire o ad operare nei mercati finanziari. Non sono inoltre fornite o supportate da TradingView. Maggiori dettagli nelle Condizioni d'uso.
Declinazione di responsabilità
Le informazioni ed i contenuti pubblicati non costituiscono in alcun modo una sollecitazione ad investire o ad operare nei mercati finanziari. Non sono inoltre fornite o supportate da TradingView. Maggiori dettagli nelle Condizioni d'uso.
