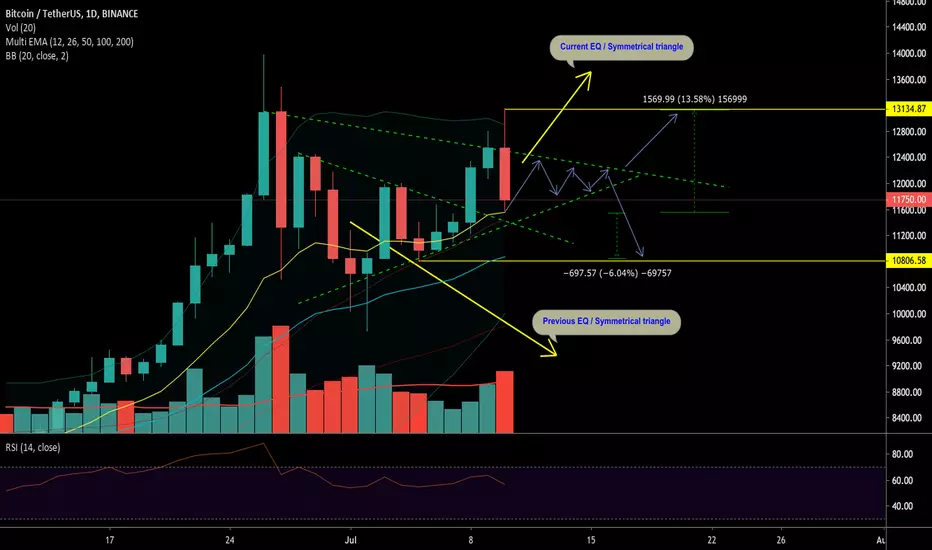
Currently the price is getting close to a strong support zone. We can find support on the 12 EMA, on the resistance line of the previous symmetrical triangle and on the support line of the symmetrical triangle where we are currently ranging in.
I see two possible outcomes ;
1. We will be trading in a equilibrium and the price range will tighten up. If we break bullish we might go back to the 13000 price zone.
2. We break bearish, we can start looking for a Higher Low on the Weekly chart. The RSI on the weekly is overbought, a higher low is about to come.
This is not a financial advice , i'm new to technical analysis and sharing thoughts with other traders.
CHECK IT OUT 😎
⬇️⬇️⬇️
youtube.com/channel/UC_UP6XvTaTEKIapdM-aKzWA
twitter.com/TheChartingArt
⬇️⬇️⬇️
youtube.com/channel/UC_UP6XvTaTEKIapdM-aKzWA
twitter.com/TheChartingArt
Declinazione di responsabilità
Le informazioni ed i contenuti pubblicati non costituiscono in alcun modo una sollecitazione ad investire o ad operare nei mercati finanziari. Non sono inoltre fornite o supportate da TradingView. Maggiori dettagli nelle Condizioni d'uso.
