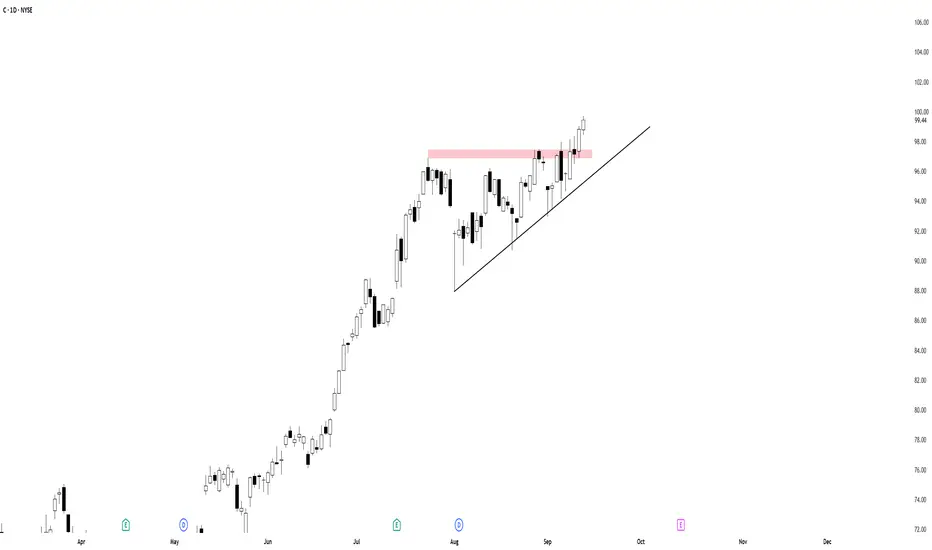
The price has broken out of an ascending triangle pattern formed between $95 and $98, showing strong follow-through. This breakout signals continuation of the prevailing uptrend.
Technical Setup: Clear series of higher lows, resistance around $97.50–$98 finally broken with a strong bullish candle.
Target: Measured move projects to around $106 ±0.5, based on the height of the triangle added to the breakout level.
Stop Loss: Immediate invalidation below $96.80 (breakout failure).
Alternative Exit: If the breakout shows soft weakness (limited follow-through, mild pullback), a wider stop can be placed under $95 (bottom of the triangle) to allow for a retest before resuming trend.
This structure suggests bullish continuation as long as price remains above the breakout zone. A retest of $97.50–$98 could offer a secondary entry opportunity.
Trade chiuso: obiettivo raggiunto
Shinobi Trading Lab – Indicators • Stats • Discipline
👉 Patreon: patreon.com/ShinobiTradingLab
👉 Patreon: patreon.com/ShinobiTradingLab
Declinazione di responsabilità
Le informazioni ed i contenuti pubblicati non costituiscono in alcun modo una sollecitazione ad investire o ad operare nei mercati finanziari. Non sono inoltre fornite o supportate da TradingView. Maggiori dettagli nelle Condizioni d'uso.