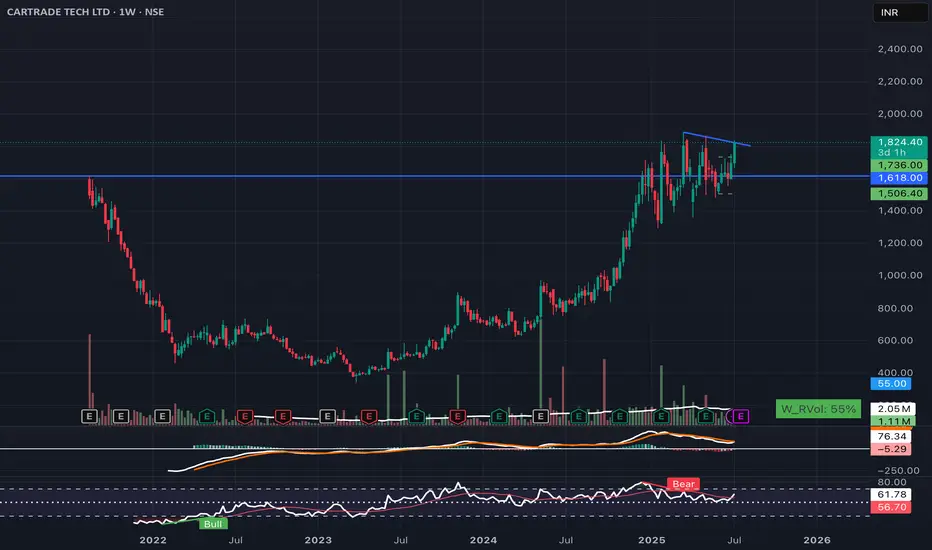
CARTRADE TECH LTD – Weekly Chart Summary
🔷 Pattern: Contracting Triangle / Symmetrical Triangle
* A descending trendline from highs near 1900 is acting as resistance
* Price is consolidating tightly within this triangle, showing strength just below resistance
🟦 Horizontal Zone (1618 - 1736)
* Major supply zone from previous highs
* Price has successfully reclaimed this zone and is holding above it, indicating demand
📊 Volume
* Volume remains steady with no distribution signs
* A breakout should ideally occur with a volume spike above 2 million shares
📉 MACD
* MACD is in positive territory, indicating bullish bias
* Signal lines are flattening, setting up for a potential bullish crossover if breakout occurs
📈 RSI
* RSI is holding above 60, a bullish zone
* No visible bearish divergence currently, healthy consolidation visible
📌 Bias: Bullish
* A breakout above the trendline (around 1880 to 1900) could lead to a strong move
* Upside potential toward 2200 to 2400 if breakout sustains
Conclusion
CARTRADE is trading in a bullish consolidation near key breakout levels. The structure suggests accumulation, and a breakout above the triangle could mark a continuation of the uptrend. Watch for high volume and a close above 1900.
Declinazione di responsabilità
Le informazioni ed i contenuti pubblicati non costituiscono in alcun modo una sollecitazione ad investire o ad operare nei mercati finanziari. Non sono inoltre fornite o supportate da TradingView. Maggiori dettagli nelle Condizioni d'uso.
Declinazione di responsabilità
Le informazioni ed i contenuti pubblicati non costituiscono in alcun modo una sollecitazione ad investire o ad operare nei mercati finanziari. Non sono inoltre fornite o supportate da TradingView. Maggiori dettagli nelle Condizioni d'uso.
