🔎 Overview:
CATI/USDT is flashing a major trend reversal signal after months of accumulation and suppression under a dominant descending trendline. For the first time in almost 10 months, price action has successfully broken out of the downtrend, potentially setting the stage for a multi-layered bullish rally.
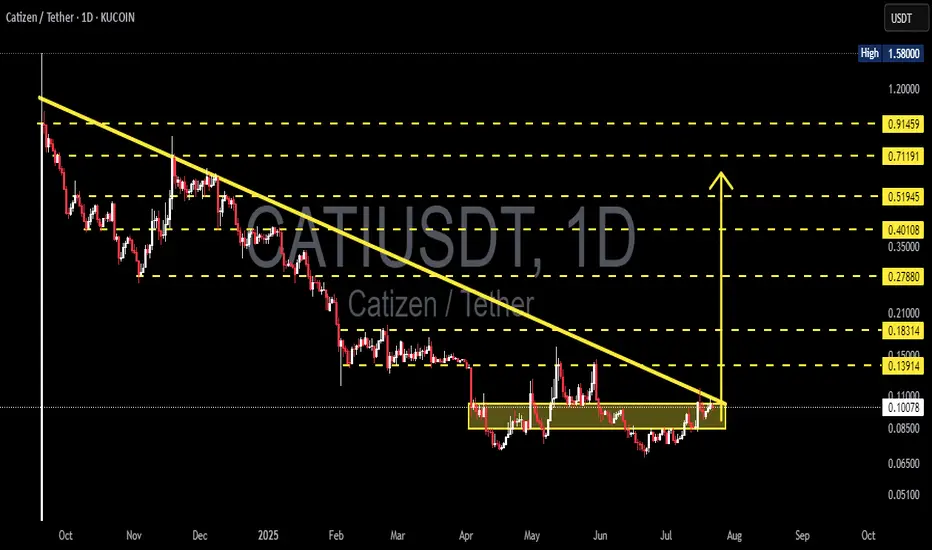
This breakout is not just a technical level — it’s a psychological shift from bearish to bullish sentiment. The consolidation zone between $0.065–$0.085 has acted as a solid accumulation base, and the breakout past $0.10 marks the beginning of a new phase.
📐 Chart Pattern Explanation:
🔻 Descending Triangle Breakout
Structure: Long-term lower highs with a flat support base.
Breakout Point: Around $0.1029, breaking the descending trendline cleanly.
Volume: A potential rise in volume post-breakout would confirm the breakout’s strength.
Target projection: Based on the height of the triangle, the potential move could extend above 200%.
This pattern is often seen at the end of a downtrend and signals a strong bullish reversal, especially when paired with horizontal accumulation like we see here.
📈 Bullish Scenario – Road to Potential 8x Gains:
If the breakout holds and gains momentum:
✅ First Target: $0.13914 – Previous local resistance.
✅ Second Target: $0.18314 – Strong resistance cluster zone.
✅ Third Target: $0.27880 – Clean psychological and structural target.
✅ Mid-term Target: $0.40108 to $0.51945 – Major Fibonacci level and previous breakdown area.
✅ Moon Target: $0.71191 to $0.91459 – If trend extends with volume and market-wide bullishness.
These targets are based on measured move projections, Fibonacci extensions, and historical price memory.
⚠️ Bearish Scenario – What Could Invalidate the Breakout?
❌ False breakout risk if price falls back below $0.095.
❌ A rejection candle or long wick at $0.13–$0.14 without volume could signal exhaustion.
❌ If Bitcoin or broader market faces correction, CATI might retrace to its base at $0.065 or even revisit $0.051.
Traders should watch for bearish divergence or sudden drop in volume as early warnings of reversal.
🧠 Strategic Notes:
Entry zone: Retest of breakout at $0.095–$0.102 could provide a low-risk entry.
Stop loss: Below $0.085 for conservative risk management.
Position sizing: Scale in during pullbacks. Don’t ape in full at resistance levels.
This setup has the classic ingredients of a low-cap altcoin explosion if momentum sustains.
🔥 Final Thoughts:
CATI/USDT is breaking free from its bearish chains and entering what could be the early stages of a parabolic move. With a textbook breakout pattern, clean structure, and well-defined levels — this is one of those charts traders dream of spotting early.
Keep your eyes on volume and structure — this could be one of the hidden gems of this cycle.
#CATIUSDT #CryptoBreakout #AltcoinGems #TechnicalAnalysis #BullishSetup #CryptoTrading #PriceAction #DescendingTriangle #BreakoutPlay #ReversalPattern
CATI/USDT is flashing a major trend reversal signal after months of accumulation and suppression under a dominant descending trendline. For the first time in almost 10 months, price action has successfully broken out of the downtrend, potentially setting the stage for a multi-layered bullish rally.
This breakout is not just a technical level — it’s a psychological shift from bearish to bullish sentiment. The consolidation zone between $0.065–$0.085 has acted as a solid accumulation base, and the breakout past $0.10 marks the beginning of a new phase.
📐 Chart Pattern Explanation:
🔻 Descending Triangle Breakout
Structure: Long-term lower highs with a flat support base.
Breakout Point: Around $0.1029, breaking the descending trendline cleanly.
Volume: A potential rise in volume post-breakout would confirm the breakout’s strength.
Target projection: Based on the height of the triangle, the potential move could extend above 200%.
This pattern is often seen at the end of a downtrend and signals a strong bullish reversal, especially when paired with horizontal accumulation like we see here.
📈 Bullish Scenario – Road to Potential 8x Gains:
If the breakout holds and gains momentum:
✅ First Target: $0.13914 – Previous local resistance.
✅ Second Target: $0.18314 – Strong resistance cluster zone.
✅ Third Target: $0.27880 – Clean psychological and structural target.
✅ Mid-term Target: $0.40108 to $0.51945 – Major Fibonacci level and previous breakdown area.
✅ Moon Target: $0.71191 to $0.91459 – If trend extends with volume and market-wide bullishness.
These targets are based on measured move projections, Fibonacci extensions, and historical price memory.
⚠️ Bearish Scenario – What Could Invalidate the Breakout?
❌ False breakout risk if price falls back below $0.095.
❌ A rejection candle or long wick at $0.13–$0.14 without volume could signal exhaustion.
❌ If Bitcoin or broader market faces correction, CATI might retrace to its base at $0.065 or even revisit $0.051.
Traders should watch for bearish divergence or sudden drop in volume as early warnings of reversal.
🧠 Strategic Notes:
Entry zone: Retest of breakout at $0.095–$0.102 could provide a low-risk entry.
Stop loss: Below $0.085 for conservative risk management.
Position sizing: Scale in during pullbacks. Don’t ape in full at resistance levels.
This setup has the classic ingredients of a low-cap altcoin explosion if momentum sustains.
🔥 Final Thoughts:
CATI/USDT is breaking free from its bearish chains and entering what could be the early stages of a parabolic move. With a textbook breakout pattern, clean structure, and well-defined levels — this is one of those charts traders dream of spotting early.
Keep your eyes on volume and structure — this could be one of the hidden gems of this cycle.
#CATIUSDT #CryptoBreakout #AltcoinGems #TechnicalAnalysis #BullishSetup #CryptoTrading #PriceAction #DescendingTriangle #BreakoutPlay #ReversalPattern
✅ Get Free Signals! Join Our Telegram Channel Here: t.me/TheCryptoNuclear
✅ Twitter: twitter.com/crypto_nuclear
✅ Join Bybit : partner.bybit.com/b/nuclearvip
✅ Benefits : Lifetime Trading Fee Discount -50%
✅ Twitter: twitter.com/crypto_nuclear
✅ Join Bybit : partner.bybit.com/b/nuclearvip
✅ Benefits : Lifetime Trading Fee Discount -50%
Declinazione di responsabilità
Le informazioni e le pubblicazioni non sono intese come, e non costituiscono, consulenza o raccomandazioni finanziarie, di investimento, di trading o di altro tipo fornite o approvate da TradingView. Per ulteriori informazioni, consultare i Termini di utilizzo.