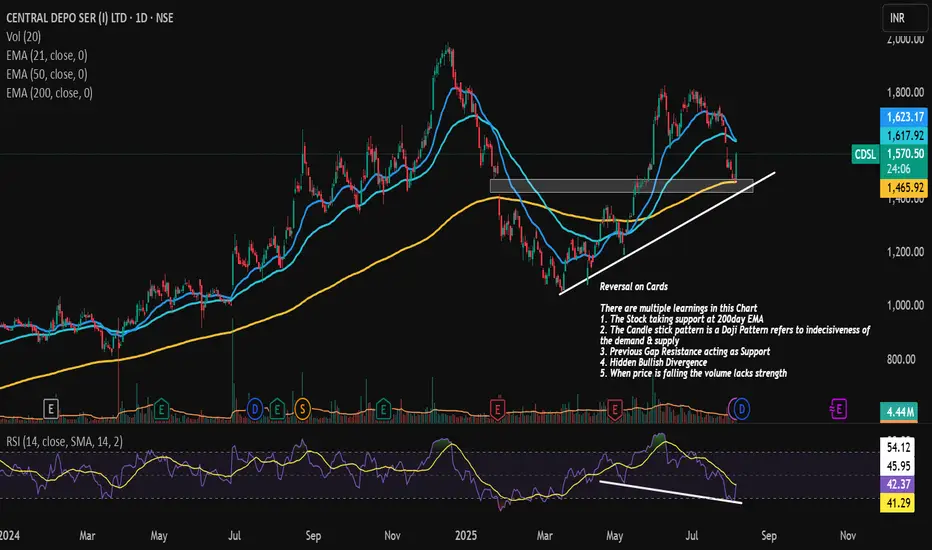
CDSL is on the verge or Reversal or Temporary Pull back
There are multiple learnings in this Chart
1. The Stock taking support at 200day EMA
2. The Candle stick pattern is a Doji Pattern refers to indecisiveness of the demand & supply
3. Previous Gap Resistance acting as Support
4. Hidden Bullish Divergence
5. When price is falling the volume lacks strength
Pubblicazioni correlate
Declinazione di responsabilità
Le informazioni ed i contenuti pubblicati non costituiscono in alcun modo una sollecitazione ad investire o ad operare nei mercati finanziari. Non sono inoltre fornite o supportate da TradingView. Maggiori dettagli nelle Condizioni d'uso.
Pubblicazioni correlate
Declinazione di responsabilità
Le informazioni ed i contenuti pubblicati non costituiscono in alcun modo una sollecitazione ad investire o ad operare nei mercati finanziari. Non sono inoltre fornite o supportate da TradingView. Maggiori dettagli nelle Condizioni d'uso.