Cetus Protocol (CETUS) is currently at a highly critical phase, trading just above a strong historical support zone that has repeatedly acted as a key price floor. The chart reveals a tight technical formation, signaling a potential for a significant move in the near term.
---
🔍 Technical Analysis:
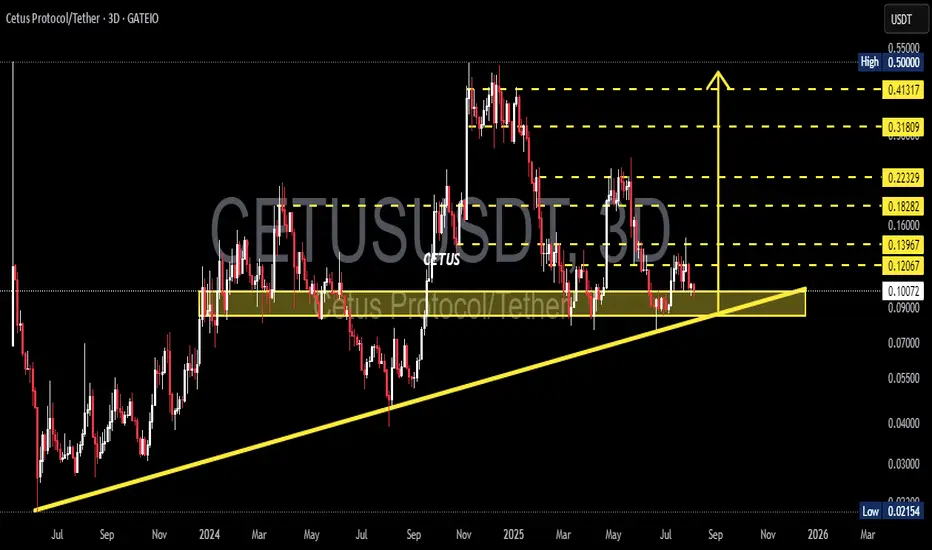
Key Support Zone: $0.09000 – $0.10084
Price is currently testing a major demand area that has historically prevented deeper drops since mid-2023.
Ascending Trendline:
A medium-term trendline from 2023 remains intact, supporting a continued higher low structure.
Decreasing Volume:
Shrinking volume suggests the market is in a state of accumulation or awaiting a strong breakout catalyst.
---
🧩 Price Structure & Patterns:
Horizontal Consolidation above support → indicates potential accumulation phase.
Ascending Triangle Support (flat support + rising trendline) → this pattern is often a bullish continuation when followed by a breakout to the upside.
---
🐂 Bullish Scenario:
If price successfully bounces from the support zone, a step-by-step upward movement becomes likely, with the following targets:
Price Level Role Notes
$0.12067 Initial Resistance Minor rejection zone
$0.13967 Flip Zone Needs breakout confirmation
$0.16000 Mid-Range Resistance Key level for further upside
$0.18282 – $0.22329 Major Bullish Target Break above this signals trend recovery
$0.31809 – $0.41317 Long-term Resistance Potential full retracement zone
A clean breakout above $0.22329 with strong volume could signal a resumption of the long-term bullish trend.
---
🐻 Bearish Scenario:
If the price breaks down below $0.09000 and closes beneath the ascending trendline:
The higher low structure will be invalidated.
Potential downside targets:
$0.07000 (minor support)
$0.05500 – $0.04000 (psychological zones)
$0.02154 (historical low)
This would indicate a shift toward distribution and a broader bearish trend.
---
🧠 Suggested Trading Strategy:
🔁 Reversal Traders: Look for bullish candlestick confirmation (e.g., hammer, engulfing) at support zone.
💥 Breakout Traders: Wait for breakout and retest above $0.13967 before entering.
🛡️ Risk Management: Tight stop-loss below $0.09000, targets aligned with resistance levels.
---
📝 Conclusion:
CETUS/USDT is at a make-or-break level, sitting right above structural support and trendline confluence. A strong bounce here could offer a great risk-reward long opportunity, while a breakdown opens the door to further downside.
Patience and confirmation will be key.
#CETUSUSDT #CETUSProtocol #CryptoBreakout #TrendlineSupport #AltcoinAnalysis #ChartPattern #BullishSetup #BearishScenario #CryptoTechnicalAnalysis
---
🔍 Technical Analysis:
Key Support Zone: $0.09000 – $0.10084
Price is currently testing a major demand area that has historically prevented deeper drops since mid-2023.
Ascending Trendline:
A medium-term trendline from 2023 remains intact, supporting a continued higher low structure.
Decreasing Volume:
Shrinking volume suggests the market is in a state of accumulation or awaiting a strong breakout catalyst.
---
🧩 Price Structure & Patterns:
Horizontal Consolidation above support → indicates potential accumulation phase.
Ascending Triangle Support (flat support + rising trendline) → this pattern is often a bullish continuation when followed by a breakout to the upside.
---
🐂 Bullish Scenario:
If price successfully bounces from the support zone, a step-by-step upward movement becomes likely, with the following targets:
Price Level Role Notes
$0.12067 Initial Resistance Minor rejection zone
$0.13967 Flip Zone Needs breakout confirmation
$0.16000 Mid-Range Resistance Key level for further upside
$0.18282 – $0.22329 Major Bullish Target Break above this signals trend recovery
$0.31809 – $0.41317 Long-term Resistance Potential full retracement zone
A clean breakout above $0.22329 with strong volume could signal a resumption of the long-term bullish trend.
---
🐻 Bearish Scenario:
If the price breaks down below $0.09000 and closes beneath the ascending trendline:
The higher low structure will be invalidated.
Potential downside targets:
$0.07000 (minor support)
$0.05500 – $0.04000 (psychological zones)
$0.02154 (historical low)
This would indicate a shift toward distribution and a broader bearish trend.
---
🧠 Suggested Trading Strategy:
🔁 Reversal Traders: Look for bullish candlestick confirmation (e.g., hammer, engulfing) at support zone.
💥 Breakout Traders: Wait for breakout and retest above $0.13967 before entering.
🛡️ Risk Management: Tight stop-loss below $0.09000, targets aligned with resistance levels.
---
📝 Conclusion:
CETUS/USDT is at a make-or-break level, sitting right above structural support and trendline confluence. A strong bounce here could offer a great risk-reward long opportunity, while a breakdown opens the door to further downside.
Patience and confirmation will be key.
#CETUSUSDT #CETUSProtocol #CryptoBreakout #TrendlineSupport #AltcoinAnalysis #ChartPattern #BullishSetup #BearishScenario #CryptoTechnicalAnalysis
✅ Get Free Signals! Join Our Telegram Channel Here: t.me/TheCryptoNuclear
✅ Twitter: twitter.com/crypto_nuclear
✅ Join Bybit : partner.bybit.com/b/nuclearvip
✅ Benefits : Lifetime Trading Fee Discount -50%
✅ Twitter: twitter.com/crypto_nuclear
✅ Join Bybit : partner.bybit.com/b/nuclearvip
✅ Benefits : Lifetime Trading Fee Discount -50%
Declinazione di responsabilità
Le informazioni ed i contenuti pubblicati non costituiscono in alcun modo una sollecitazione ad investire o ad operare nei mercati finanziari. Non sono inoltre fornite o supportate da TradingView. Maggiori dettagli nelle Condizioni d'uso.