Hey everyone,
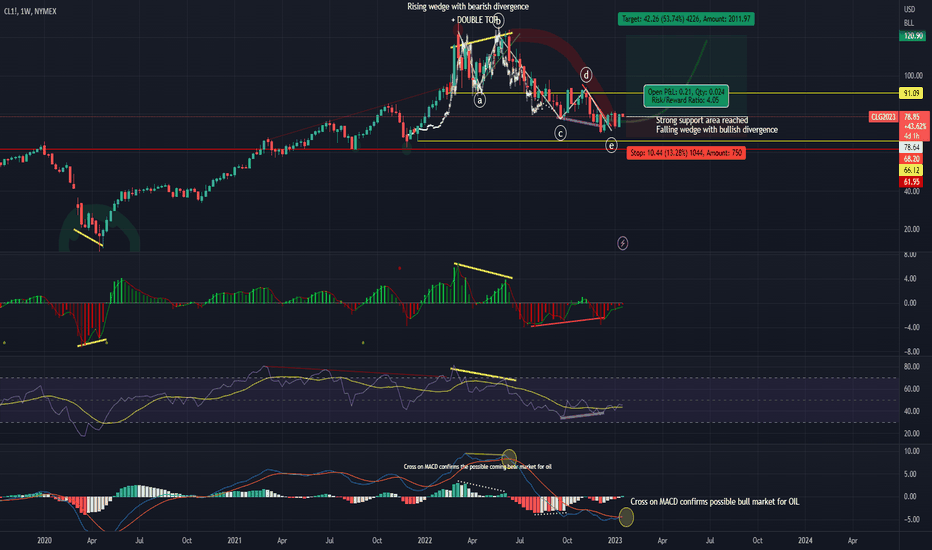
it looks like smart money bought really cheap in Covid crysis turn and now the prices are really high
Fundamentals are all bad sh1* all here and there now but the chart and TA indicators speaks for itself on this Weekly chart for me.
What I see is rising wedge formation with bearish divergence all over major indicators with very likely double top formation.
I would wait a little bit more for that bear diverged MACD to cross out to enter levearaged short on this oil setup.


This Oil & BTC bubble is so much fun to ride


Money about to moove and sentiment clima about to change very soon very likely
Chachain
KEYWORDS
Oil, CL1!, R:R, money management, risk, reward, technique, style, trading, bitcoin , bitcointrading, profitable trading, profittrading, profit trading, secret, divergence, bull divergence, bear divergence, divergencetrading, divergence trading, trading strategy, how to trade bitcoin , bitcoin trades, bitcoin trading, make profit, take profit, trading strategy, trading technique, successful, successful trader, successful technique, successful strategy, successful secret, how to trade, trend analysis, technical analysis , indicators, rsi , relative strenght index, let it rain, successful life, easy strategy, easy trading, easy technique, make money, crypto investing, investing, crypto, cryptocurrency, cryptocurrencies, mentoring, money, chartart, beyond
it looks like smart money bought really cheap in Covid crysis turn and now the prices are really high
Fundamentals are all bad sh1* all here and there now but the chart and TA indicators speaks for itself on this Weekly chart for me.
What I see is rising wedge formation with bearish divergence all over major indicators with very likely double top formation.
I would wait a little bit more for that bear diverged MACD to cross out to enter levearaged short on this oil setup.

This Oil & BTC bubble is so much fun to ride

Money about to moove and sentiment clima about to change very soon very likely
Chachain
KEYWORDS
Oil, CL1!, R:R, money management, risk, reward, technique, style, trading, bitcoin , bitcointrading, profitable trading, profittrading, profit trading, secret, divergence, bull divergence, bear divergence, divergencetrading, divergence trading, trading strategy, how to trade bitcoin , bitcoin trades, bitcoin trading, make profit, take profit, trading strategy, trading technique, successful, successful trader, successful technique, successful strategy, successful secret, how to trade, trend analysis, technical analysis , indicators, rsi , relative strenght index, let it rain, successful life, easy strategy, easy trading, easy technique, make money, crypto investing, investing, crypto, cryptocurrency, cryptocurrencies, mentoring, money, chartart, beyond
Anonymous investor teaches how to master the game towards PERSONAL GRADUAL GROWTH4FREE
IF YOU LIKE MY WORK, THEN PLEASE CONSIDER GIVING A THUMB UP TO SUPPORT ME & hit follow so you dont miss any of my new ideas.
Thanks
IF YOU LIKE MY WORK, THEN PLEASE CONSIDER GIVING A THUMB UP TO SUPPORT ME & hit follow so you dont miss any of my new ideas.
Thanks
Pubblicazioni correlate
Declinazione di responsabilità
Le informazioni ed i contenuti pubblicati non costituiscono in alcun modo una sollecitazione ad investire o ad operare nei mercati finanziari. Non sono inoltre fornite o supportate da TradingView. Maggiori dettagli nelle Condizioni d'uso.

