Long
The chart represents the technical analysis of CLV/USDT on the 1

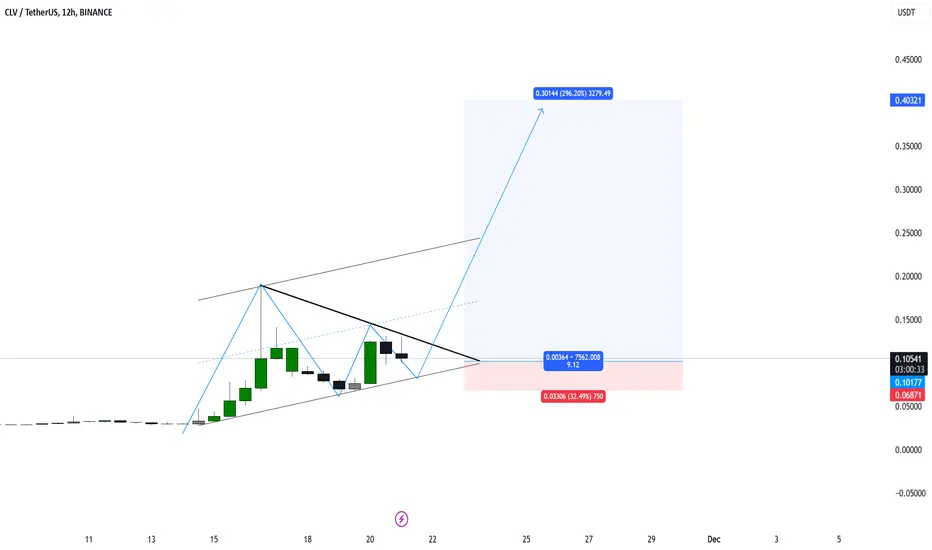
The chart represents the technical analysis of CLV/USDT on the 12-hour timeframe. Here's the detailed breakdown:
Key Observations:
Symmetrical Triangle:
The price is forming a symmetrical triangle, signaling potential breakout scenarios.
Currently, the price is consolidating near the triangle's apex, increasing the likelihood of a sharp move soon.
Harmonic Pattern:
A potential harmonic structure is forming, indicating a bullish setup if the breakout happens to the upside.
Support and Stop Loss:
Support Zone: 0.10177 USDT – A critical area where price may bounce.
Stop Loss: 0.06871 USDT – Marked below the lower structure to manage risks.
Resistance Levels:
Immediate breakout above the triangle could lead to a significant move toward the higher targets.
Target Levels:
Target 1: 0.30144 USDT (Projected breakout level with a potential 296% gain from current levels).
Target 2: 0.40321 USDT (Further extension point based on harmonic analysis).
Scenarios:
Bullish Breakout:
If the price breaks above the symmetrical triangle, the targets of 0.30144 USDT and 0.40321 USDT are achievable.
The bullish momentum could accelerate due to the tight consolidation.
Bearish Breakdown:
If the price falls below 0.10177 USDT, the bearish scenario may play out.
A break below the 0.06871 USDT stop-loss level indicates invalidation of the bullish setup.
Recommendations:
Entry Strategy: Look for a confirmed breakout above the triangle for a safer entry.
Stop Loss: Place it below 0.06871 USDT to limit downside risks.
Take Profit:
TP1: 0.30144 USDT.
TP2: 0.40321 USDT.
Subscribe to my Telegram Channel 👉 :
t.me/addlist/y5mi70s3c0Y3MDQ0
Subscribe to my X 👉 : x.com/VIPROSETR
t.me/addlist/y5mi70s3c0Y3MDQ0
Subscribe to my X 👉 : x.com/VIPROSETR
Declinazione di responsabilità
Le informazioni ed i contenuti pubblicati non costituiscono in alcun modo una sollecitazione ad investire o ad operare nei mercati finanziari. Non sono inoltre fornite o supportate da TradingView. Maggiori dettagli nelle Condizioni d'uso.