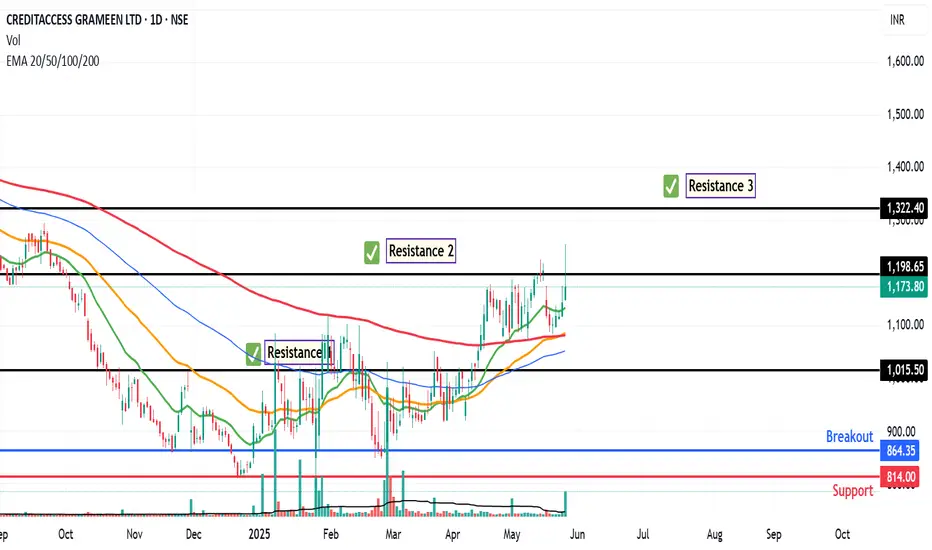
The chart of CREDITACC provides delineates critical price thresholds that signify breakout points, along with specific support levels that serve as indicators of where buying interest may manifest.
Additionally, the chart highlights regions likely to act as ceiling points for future price ascensions, allowing for informed decisions on entry and exit strategies.
Additionally, the chart highlights regions likely to act as ceiling points for future price ascensions, allowing for informed decisions on entry and exit strategies.
Trade chiuso: obiettivo raggiunto
Reached to Resistance 3. Trade ClosePubblicazioni correlate
Declinazione di responsabilità
Le informazioni ed i contenuti pubblicati non costituiscono in alcun modo una sollecitazione ad investire o ad operare nei mercati finanziari. Non sono inoltre fornite o supportate da TradingView. Maggiori dettagli nelle Condizioni d'uso.
Pubblicazioni correlate
Declinazione di responsabilità
Le informazioni ed i contenuti pubblicati non costituiscono in alcun modo una sollecitazione ad investire o ad operare nei mercati finanziari. Non sono inoltre fornite o supportate da TradingView. Maggiori dettagli nelle Condizioni d'uso.