Crompton 52-Week Low Reversal Setup – Oversold Swing Trade
1. Price Action
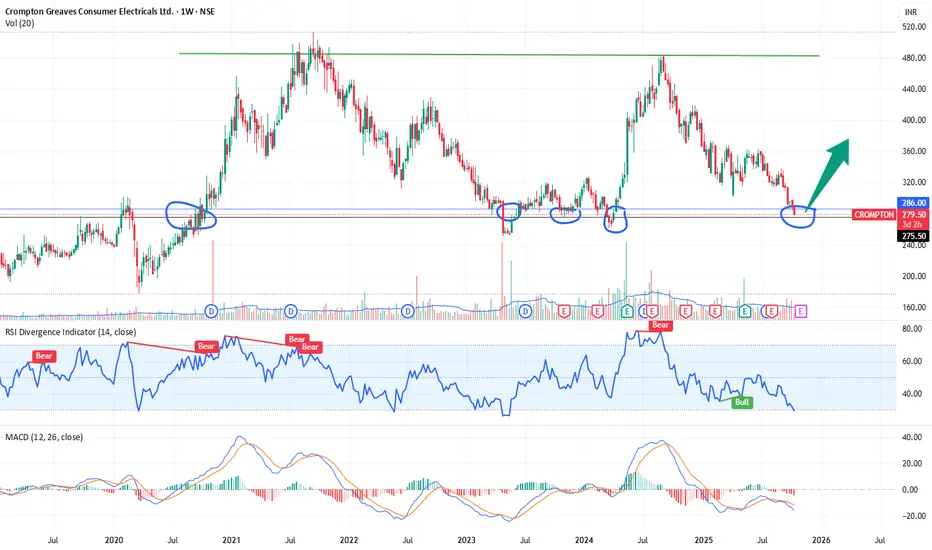
The stock is trading around ₹279–₹286, which is exactly at its 52-week low and a historical support zone from mid-2022.
Previous rebounds from this same area have led to 30–40% upside swings, indicating it’s a well-tested demand zone.
2. RSI (Relative Strength Index)
RSI at 23.8 → clearly oversold, near the lower extreme of its historical range.
In past instances (see mid-2022, mid-2023), RSI below 30 at this price level resulted in strong upward bounces — a potential bullish divergence may soon form.
3. MACD
MACD lines are deeply negative and starting to flatten out, which often precedes a momentum reversal.
If the MACD signal line crosses upward, that could confirm the beginning of a bullish swing.
4. Volume
The recent decline shows moderate-to-low volume, suggesting selling exhaustion rather than aggressive breakdown pressure.
5. Support and Resistance
Immediate support: ₹275–₹278 (current zone).
Upside swing targets: ₹305 → ₹325 → ₹350 (previous resistance and Fibonacci retracement zones).
Stop-loss: Below ₹272 (daily close).
Confirmation to Watch For
Bullish candle with volume > average on daily chart.
RSI rising above 30.
MACD crossover confirmation.
Price closing back above ₹285–₹290 (key trigger zone).
Note: This chart is for study and educational purposes only. Not a trade recommendation. Please do your own research and risk assessment before taking any position.
Declinazione di responsabilità
Le informazioni e le pubblicazioni non sono intese come, e non costituiscono, consulenza o raccomandazioni finanziarie, di investimento, di trading o di altro tipo fornite o approvate da TradingView. Per ulteriori informazioni, consultare i Termini di utilizzo.
Declinazione di responsabilità
Le informazioni e le pubblicazioni non sono intese come, e non costituiscono, consulenza o raccomandazioni finanziarie, di investimento, di trading o di altro tipo fornite o approvate da TradingView. Per ulteriori informazioni, consultare i Termini di utilizzo.