📌 Crude Oil Futures (MCX) – Key Levels & Market Outlook
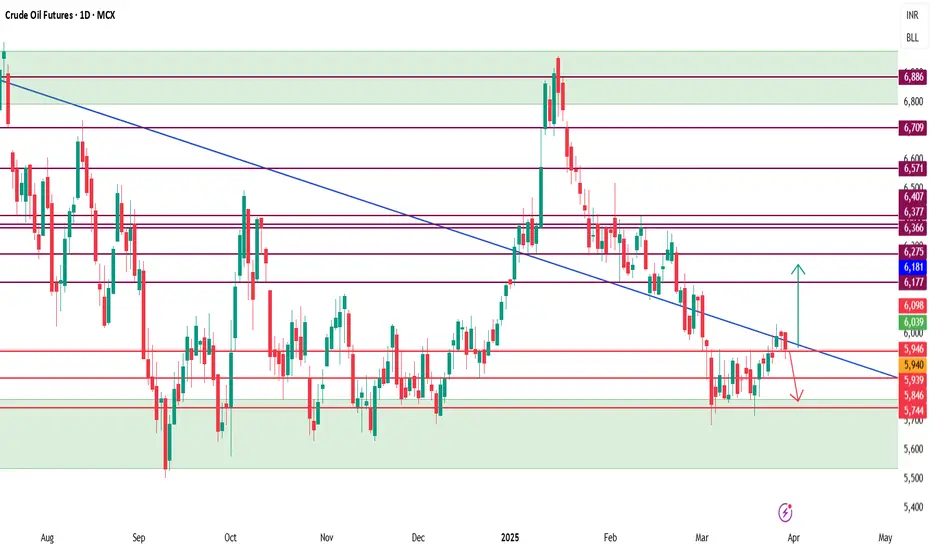
Crude Oil Futures (MCX) is currently trading near a strong support level at ₹5900. If this level holds, we could see a potential recovery towards ₹6000-₹6100, with further upside momentum targeting ₹6200-₹6300. However, a break below ₹5900 may invite further downside pressure.
🔍 Technical Indicators:
📊 Bollinger Bands: Price is testing the lower band near ₹5900, suggesting a possible bounce if supported by buying interest. A breakout above ₹6100 could signal increased bullish momentum.
📈 ADX (Average Directional Index): Currently around 22, indicating a weak trend. A rise above 25 would suggest stronger directional movement.
📉 Stochastic Oscillator: In the oversold zone (below 20), signaling a potential reversal if buying pressure increases.
📊 Open Interest & Volume: Increasing OI with price recovery could confirm strength, while declining OI on rallies may indicate weak buying conviction.
📌 Key Levels to Watch:
✅ Support Level: ₹5900
📍 Resistance Zone: ₹6000-₹6100
🚀 Upside Targets: ₹6200-₹6300
⚠ Breakdown Risk: Below ₹5900 could lead to a decline toward ₹5800 or lower.
A break above ₹6100 could fuel bullish momentum toward ₹6200-₹6300, while a failure to hold ₹5900 may result in extended selling pressure. Keep an eye on global crude demand, inventory data, and geopolitical developments for additional confirmation.
Declinazione di responsabilità
Le informazioni e le pubblicazioni non sono intese come, e non costituiscono, consulenza o raccomandazioni finanziarie, di investimento, di trading o di altro tipo fornite o approvate da TradingView. Per ulteriori informazioni, consultare i Termini di utilizzo.
Declinazione di responsabilità
Le informazioni e le pubblicazioni non sono intese come, e non costituiscono, consulenza o raccomandazioni finanziarie, di investimento, di trading o di altro tipo fornite o approvate da TradingView. Per ulteriori informazioni, consultare i Termini di utilizzo.