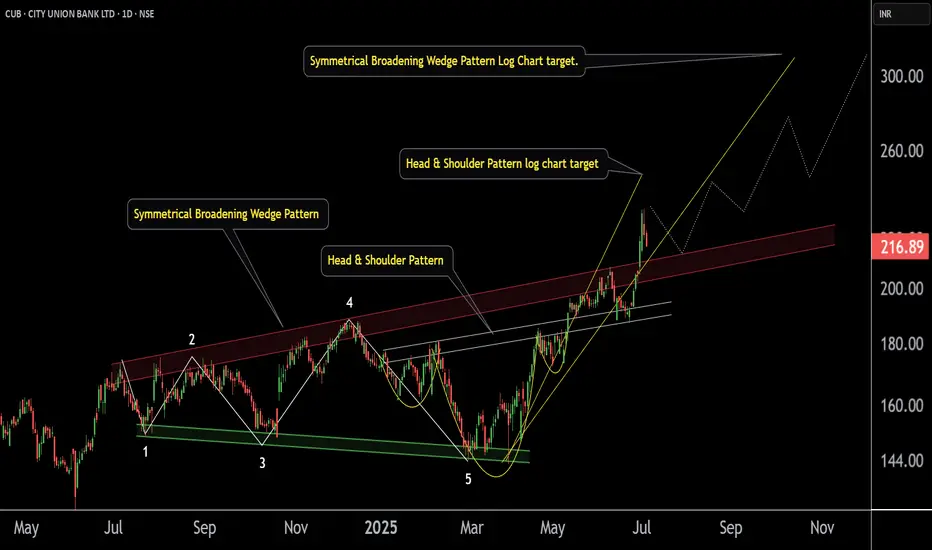
This is the Daily Chart of City Union Bank .
CUB has formed a Broadening Wedge pattern on the daily chart, with a breakout near the ₹200 support zone. Post breakout, the pattern suggests potential upside targets of ₹274 and ₹310
On the 4-hour chart, the stock has formed a Head and Shoulders pattern, with a breakout at ₹190, which has already been retested. The first target of the pattern has been achieved, while the next potential target is ₹250.
Thank You !!
@RahulSaraoge
Connect us at t.me/stridesadvisory
Connect us at t.me/stridesadvisory
Declinazione di responsabilità
Le informazioni e le pubblicazioni non sono intese come, e non costituiscono, consulenza o raccomandazioni finanziarie, di investimento, di trading o di altro tipo fornite o approvate da TradingView. Per ulteriori informazioni, consultare i Termini di utilizzo.