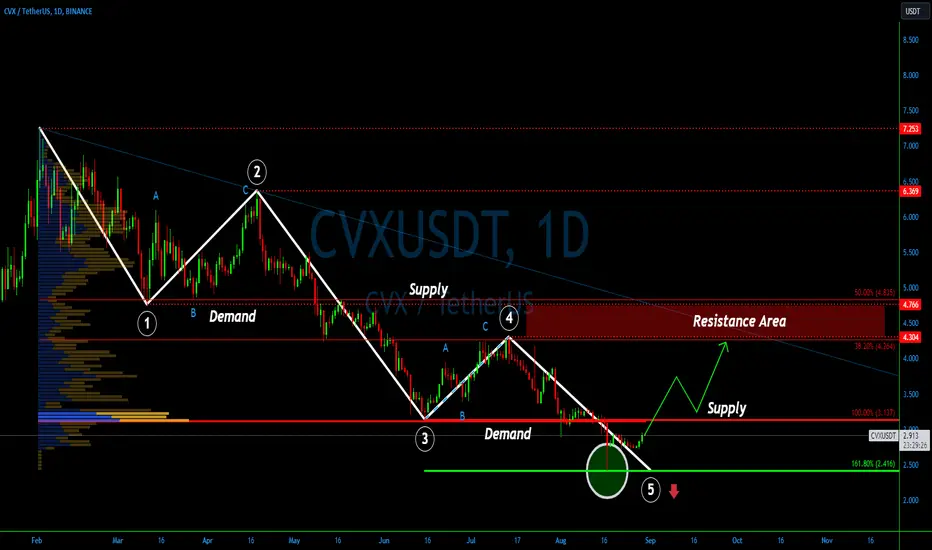
💎The #CVXUSDT chart is currently painting a fascinating narrative, reminiscent of the classic Elliot Wave theory. Since the dawn of this year, the asset has witnessed a consistent dip. Between February and August, #CVX plummeted by a staggering 66.6%, leaving investors pondering about its future prospects.
💎However, there's a silver lining for the optimists. A few weeks ago, #CVX might have wrapped up its 5th downward wave, signaling the end of the Elliot Wave cycle. This speculation stems from the impeccable bounce off the 161.8% Fibonacci support, precisely at $2.416. Such a move often heralds a potential shift in the long-term trend, and our team is gearing up to respond.
💎Our next milestone? We're keenly observing the $3.13 supply zone, which previously played the role of a demand area. A confident breach above this threshold could see it morph back into a support zone, paving the way for a bullish trajectory. If this transformation occurs, #CVX might embark on an upward journey, possibly targeting the resistance bracket of $4.26 - $4.83. This could translate to a potential 50% price surge in the forthcoming weeks. But remember, this is just the initial resistance; there's room for the price to soar by 100% or even more.
For those eager to stay abreast of the evolving #CVX landscape, keep your eyes peeled for our updates.
Want to trade like a PRO without the 15+ year learning curve?
🫳Steal the edge - follow seasoned team of traders at mycryptoparadise.com (FREE)
✅🎖️Or go full throttle with PRO strategy + killer entry/exit signals - t.me/MCPsupportbot
🫳Steal the edge - follow seasoned team of traders at mycryptoparadise.com (FREE)
✅🎖️Or go full throttle with PRO strategy + killer entry/exit signals - t.me/MCPsupportbot
Declinazione di responsabilità
Le informazioni ed i contenuti pubblicati non costituiscono in alcun modo una sollecitazione ad investire o ad operare nei mercati finanziari. Non sono inoltre fornite o supportate da TradingView. Maggiori dettagli nelle Condizioni d'uso.