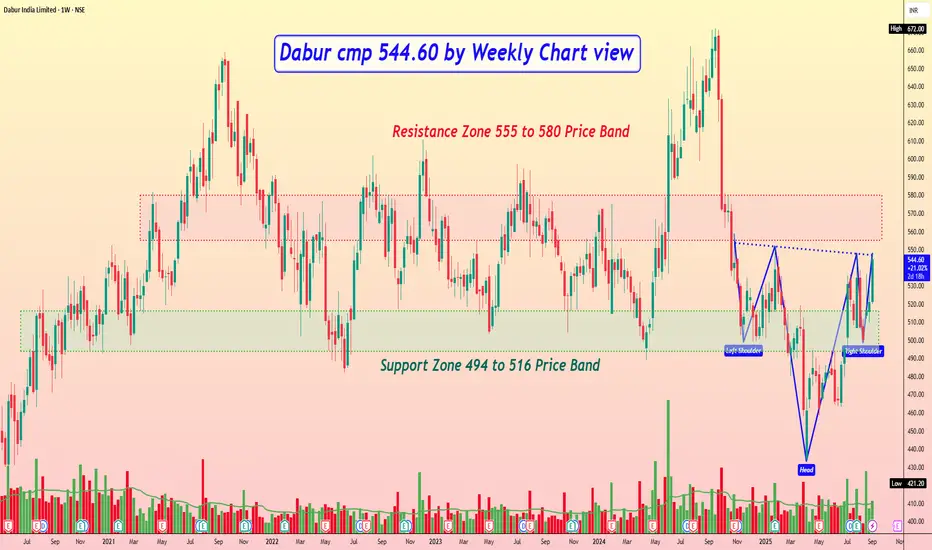
Dabur cmp 544.60 by Weekly Chart view
- Support Zone 494 to 516 Price Band
- Resistance Zone 494 to 516 Price Band
- Breakout probable basis ongoing Support Zone test retest
- Closely considerate Bullish Head & Shoulders with Resistance Zone neckline
- Volumes are seen spiking well above average traded quantity over the past few weeks
- Favorably trending Technical Indicator signals shown by BB, EMA, MACD, RSI, SuperTrend
Pubblicazioni correlate
Declinazione di responsabilità
Le informazioni ed i contenuti pubblicati non costituiscono in alcun modo una sollecitazione ad investire o ad operare nei mercati finanziari. Non sono inoltre fornite o supportate da TradingView. Maggiori dettagli nelle Condizioni d'uso.
Pubblicazioni correlate
Declinazione di responsabilità
Le informazioni ed i contenuti pubblicati non costituiscono in alcun modo una sollecitazione ad investire o ad operare nei mercati finanziari. Non sono inoltre fornite o supportate da TradingView. Maggiori dettagli nelle Condizioni d'uso.