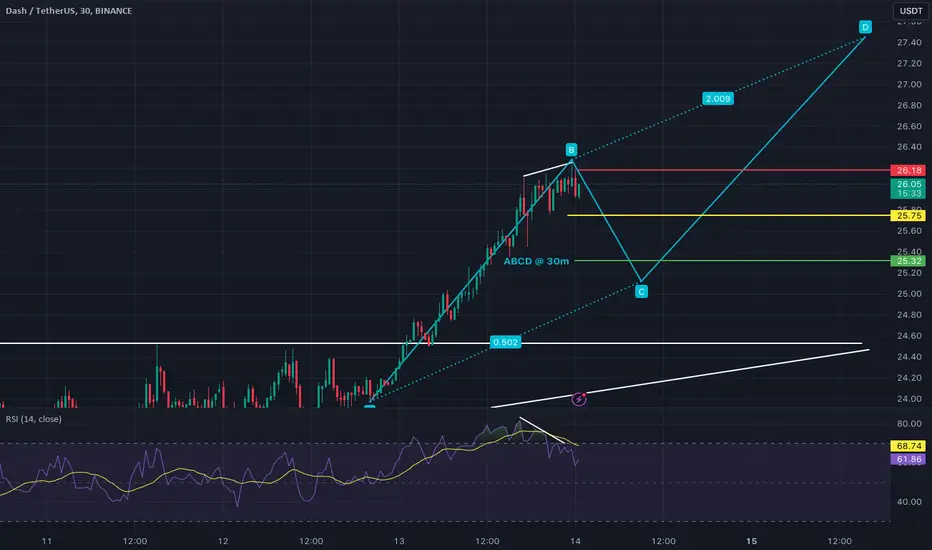
This crypto pair had a bull run which I traded with a buy stop and hit the target. At 30m time frame it made a divergence. So, I plotted ABCD Harmonic @ 30m time frame. I waited for the setup to confirm and once showed signs of retracement from B to C, a pending order of Sell Stop to enter the trade till or just before point C.
The Signal is:
EP: 25.75
SL: 26.18
TP: 25.32
RR: 2%
Lots: 431.58
The Signal is:
EP: 25.75
SL: 26.18
TP: 25.32
RR: 2%
Lots: 431.58
Nota
Currently there is a bearish divergence and now the scenario has changed. I have removed the ABCD harmonics. Chart may make Head Shoulder pattern. Waiting for the Neckline break.Declinazione di responsabilità
Le informazioni e le pubblicazioni non sono intese come, e non costituiscono, consulenza o raccomandazioni finanziarie, di investimento, di trading o di altro tipo fornite o approvate da TradingView. Per ulteriori informazioni, consultare i Termini di utilizzo.
Declinazione di responsabilità
Le informazioni e le pubblicazioni non sono intese come, e non costituiscono, consulenza o raccomandazioni finanziarie, di investimento, di trading o di altro tipo fornite o approvate da TradingView. Per ulteriori informazioni, consultare i Termini di utilizzo.
