The DFM Index (\
🔍 What the Chart is Saying:
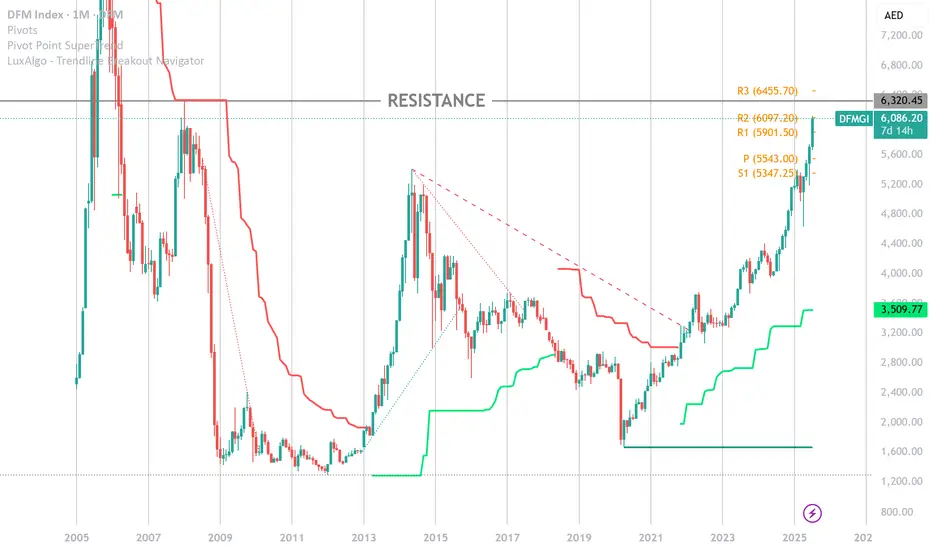
* The monthly candles show strong bullish momentum, with 7 consecutive green bars and a +6.67% monthly gain so far.
* RSI is deeply overbought at 82.80, which historically signals cooling-off zones or consolidation phases. ⚠️
* The index has broken out of a multi-year accumulation zone (between \~2,300 and \~4,000), suggesting a long-term trend reversal is intact. 📈
* Current price is far extended from both the Hull MA (9) at 6,096 and historical pivot levels (Classic P = 5,542.98), indicating stretched conditions. 🧭
🧠 Key Levels to Watch:
* Immediate Resistance: 6,320 (multi-year peak zone)
* Support: 5,901 (R1), then stronger floor near 5,542 (pivot)
* If we break above 6,320 with volume, upside continuation toward **6,651 (R3)** is likely 🔓
⚖️ Insight:
DFM is on fire 🔥, but risk is rising. The structure remains bullish, but traders should watch for signs of bearish divergence or exhaustion candles as we near historical highs. 📉 A healthy pullback could offer better entry zones for trend-followers.
📌 Summary:
🌟 Trend = Bullish
📈 Momentum = Strong but Overheated
🕰️ Outlook = Wait for confirmation or consolidation
Declinazione di responsabilità
Le informazioni e le pubblicazioni non sono intese come, e non costituiscono, consulenza o raccomandazioni finanziarie, di investimento, di trading o di altro tipo fornite o approvate da TradingView. Per ulteriori informazioni, consultare i Termini di utilizzo.
Declinazione di responsabilità
Le informazioni e le pubblicazioni non sono intese come, e non costituiscono, consulenza o raccomandazioni finanziarie, di investimento, di trading o di altro tipo fornite o approvate da TradingView. Per ulteriori informazioni, consultare i Termini di utilizzo.