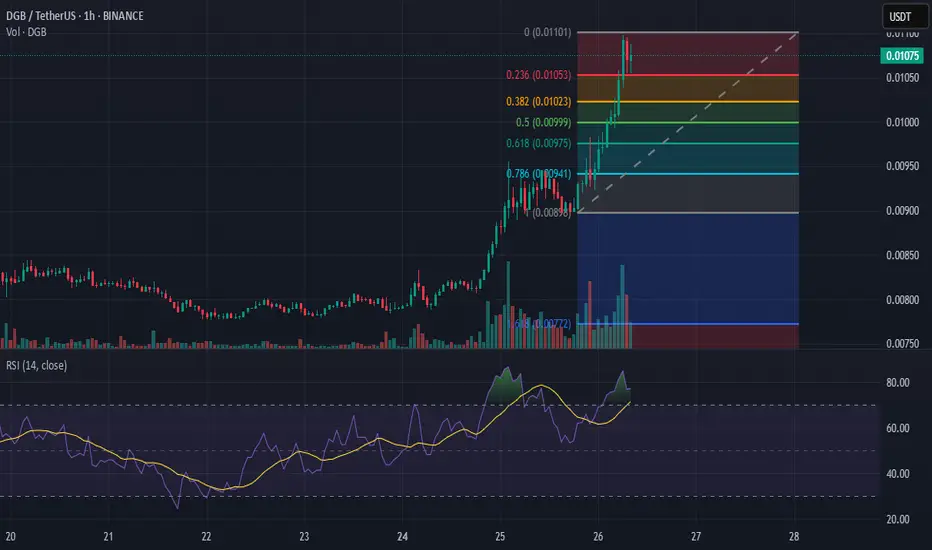
The DGB/USDT pair on Binance is currently in a strong uptrend, as seen in the 1-hour chart. The price has surged, breaking key resistance levels and reaching 0.01078 USDT. The Fibonacci retracement levels suggest potential support at 0.618 (0.00975) and 0.5 (0.00999), which could act as buy zones if a pullback occurs. Additionally, the Relative Strength Index (RSI) is at 77.69, indicating overbought conditions, which might lead to short-term consolidation or correction. Traders should watch for volume confirmations and consider setting a trailing stop-loss to lock in profits while monitoring potential retracement levels.
Declinazione di responsabilità
Le informazioni ed i contenuti pubblicati non costituiscono in alcun modo una sollecitazione ad investire o ad operare nei mercati finanziari. Non sono inoltre fornite o supportate da TradingView. Maggiori dettagli nelle Condizioni d'uso.
Declinazione di responsabilità
Le informazioni ed i contenuti pubblicati non costituiscono in alcun modo una sollecitazione ad investire o ad operare nei mercati finanziari. Non sono inoltre fornite o supportate da TradingView. Maggiori dettagli nelle Condizioni d'uso.