#Dixon Technologies (India) Ltd. - Technical Analysis Report
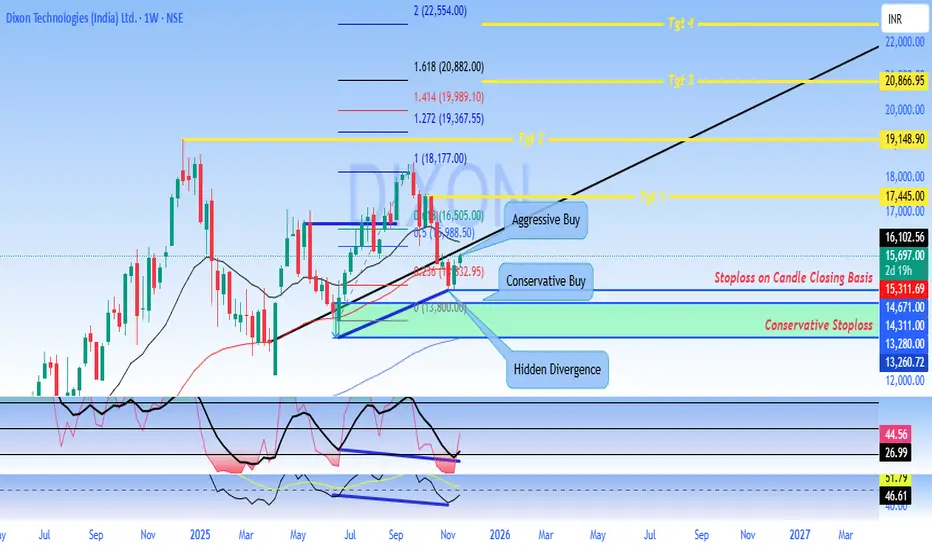
Current Price:15,697.00
Timeframe: Weekly Chart Analysis
Market Structure Overview
Dixon Technologies is currently trading at 15,697, showing signs of potential #bullish #momentum after a period of #consolidation. The #stock has been forming a significant base pattern following its decline from #all-time highs near 18,177.
#Key Technical Levels
#Support Zones
- Primary Support: 13,800 - 14,311 (Conservative Stoploss zone)
- Secondary Support: 13,260 - 13,280
- Critical Support: 12,000 (major psychological level)
#Resistance Zones
- Immediate Resistance: 16,102 - 16,505
- Key Resistance 1: 17,445 (Target 1)
- Key Resistance 2: 19,148 (Target 2)
- Major Resistance: 20,866 - 22,000 (Target 3 & 4 zone)
#Chart Pattern Analysis
The weekly chart reveals a **potential bullish reversal pattern** with the following characteristics:
1. Hidden Divergence: The chart shows hidden bullish divergence on momentum indicators, suggesting underlying strength despite recent price consolidation
2. Consolidation Box: A clear accumulation zone has formed between 13,800 and 16,500
3. Trend Channel: A rising trend channel indicates the potential for continued upward movement toward the 20,000+ zone
#Trading Strategies
#Aggressive Buy Setup
- Entry Zone: 16,505 - 16,102 (on breakout confirmation)
- Target Sequence: 17,445 → 19,148 → 20,866
- Stop Loss: Below 15,311 on candle closing basis
- Risk-Reward: Favorable 1:3+ ratio
#Conservative Buy Setup
- Entry Zone: 15,697 - 15,311 (current levels)
- Target Sequence: 17,445 → 19,148
- Stop Loss: Below 14,311 on candle closing basis (Conservative Stoploss)
- Risk-Reward: Approximately 1:2.5 ratio
#Momentum Indicators
The lower panel indicators suggest:
- Recovery from oversold conditions
- Building positive momentum
- Potential for sustained upward movement if key resistance levels are breached
#Fibonacci Levels
Key Fibonacci retracement/extension levels marked on the chart:
- 1.618 Extension: 20,882
- 1.414 Extension: 19,989
- 1.272 Extension: 19,367
- 1.000 Level: 18,177
#Outlook
Bullish Scenario: A sustained move above 16,505 with strong volume could trigger momentum toward 17,445 initially, with extended targets at 19,148 and potentially 20,866+. The stock appears to be in an accumulation phase with potential for a significant upside breakout.
Bearish Scenario: Failure to hold above 14,311 on a closing basis would invalidate the bullish setup and could lead to a retest of 13,260-13,280 support zone.
#Risk Management.
- Always use stop-loss orders on a candle closing basis - Position sizing should not exceed 2-3% of total portfolio value - Avoid overleveraging in options or futures - Monitor volume confirmation on breakout levels
DISCLAIMER
This analysis is for educational and informational purposes only and should NOT be considered as financial advice or a recommendation to buy or sell securities.
- Past performance is not indicative of future results - Trading and investing in stocks involves substantial risk of loss - All investment decisions should be made based on your own research, risk tolerance, and financial situation - Please consult with a SEBI-registered financial advisor before making any investment decisions - The author/analyst is not responsible for any profits or losses incurred based on this analysis - Technical analysis has limitations and should be combined with fundamental analysis - Market conditions can change rapidly, and all levels mentioned are subject to change
**Trade at your own risk. Always do your own due diligence.**
*Analysis created using TradingView charts | Not SEBI Registered Investment Advice*
Pubblicazioni correlate
Declinazione di responsabilità
Le informazioni e le pubblicazioni non sono intese come, e non costituiscono, consulenza o raccomandazioni finanziarie, di investimento, di trading o di altro tipo fornite o approvate da TradingView. Per ulteriori informazioni, consultare i Termini di utilizzo.