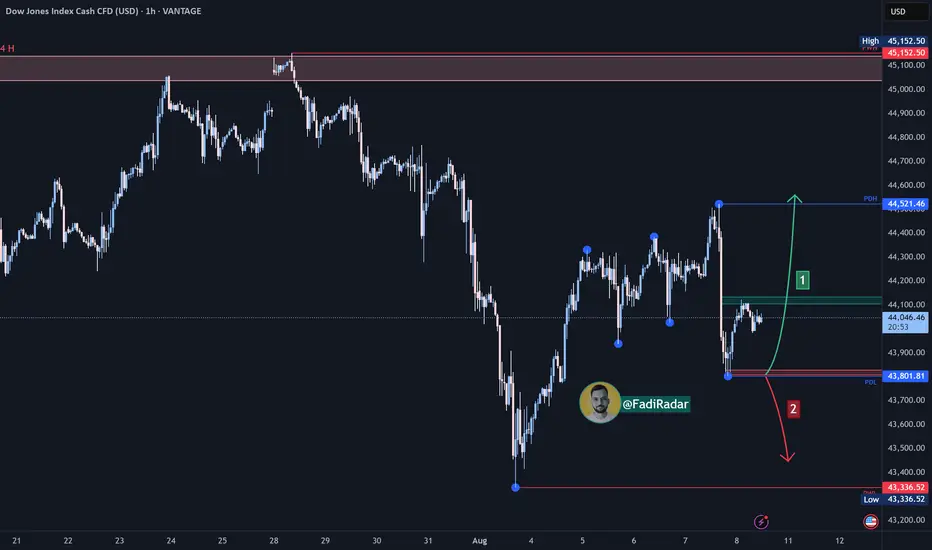
The Dow Jones index is currently moving sideways and is trading near the $44,000 level.
🔻 Bearish Scenario:
If selling pressure leads to a break below the $43,800 area, the index may drop to test the $43,300 level, which is considered a critical support in the short term.
🔺 Bullish Scenario:
The price may test PDL (Previous Day Low) at $43,800 as a support zone and bounce upward. If the index breaks and holds above $44,100, this could lead to a continuation toward $44,520, and then to $45,000, a key resistance zone.
⚠️ Disclaimer:
This analysis is not financial advice. It is recommended to monitor the markets and carefully analyze the data before making any investment decisions.
Declinazione di responsabilità
Le informazioni e le pubblicazioni non sono intese come, e non costituiscono, consulenza o raccomandazioni finanziarie, di investimento, di trading o di altro tipo fornite o approvate da TradingView. Per ulteriori informazioni, consultare i Termini di utilizzo.
Declinazione di responsabilità
Le informazioni e le pubblicazioni non sono intese come, e non costituiscono, consulenza o raccomandazioni finanziarie, di investimento, di trading o di altro tipo fornite o approvate da TradingView. Per ulteriori informazioni, consultare i Termini di utilizzo.