The
🚨 CLEAR REVERSAL SIGNALS
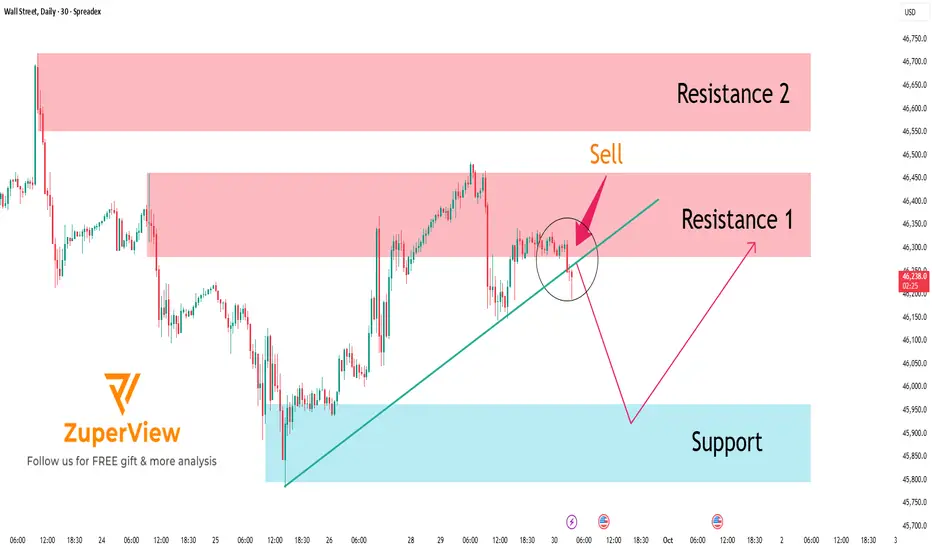
- At Resistance 1, we saw multiple rejection candles with strong bearish bodies.
- Additionally, the MA Plot has turned downward, signaling a possible shift in trend.
- Price also touched the 4-level structure zone of support/resistance, adding confluence to the area.
- Immediately after, the market reversed and dropped sharply with strong bearish candles, confirming the presence of selling pressure and strengthening the short bias.
📉 PREFERRED SCENARIO – SHORT WITH THE TREND
With the current momentum, the preferred scenario is:
🔻 Price is likely to continue dropping toward the Support Zone: 45,459 – 45,798
This zone serves as a logical short-term target for any short positions taken at Resistance 1. Once price reaches this area, traders can consider partial or full take-profits, depending on market reaction.
🧠 TRADE IDEA
- Action: 🔻 Short
- Entry Zone: 46,279 – 46,445
- Stop Loss: Above 46,550
- Take Profit: 45,800 – 45,500
✅ CONCLUSION
US30 is under visible selling pressure after rejecting Resistance 1 and reacting strongly at multiple confluence levels. The technical setup favors a trend-following short strategy, with proper risk management and patience around key levels to confirm next moves.
Please like and comment to support our traders. Your feedback motivates us to produce more analysis in the future 🙏✨
Declinazione di responsabilità
Le informazioni e le pubblicazioni non sono intese come, e non costituiscono, consulenza o raccomandazioni finanziarie, di investimento, di trading o di altro tipo fornite o approvate da TradingView. Per ulteriori informazioni, consultare i Termini di utilizzo.
Declinazione di responsabilità
Le informazioni e le pubblicazioni non sono intese come, e non costituiscono, consulenza o raccomandazioni finanziarie, di investimento, di trading o di altro tipo fornite o approvate da TradingView. Per ulteriori informazioni, consultare i Termini di utilizzo.