📊 DRREDDY – Falling Wedge Breakout Analysis
Date: August 2, 2025
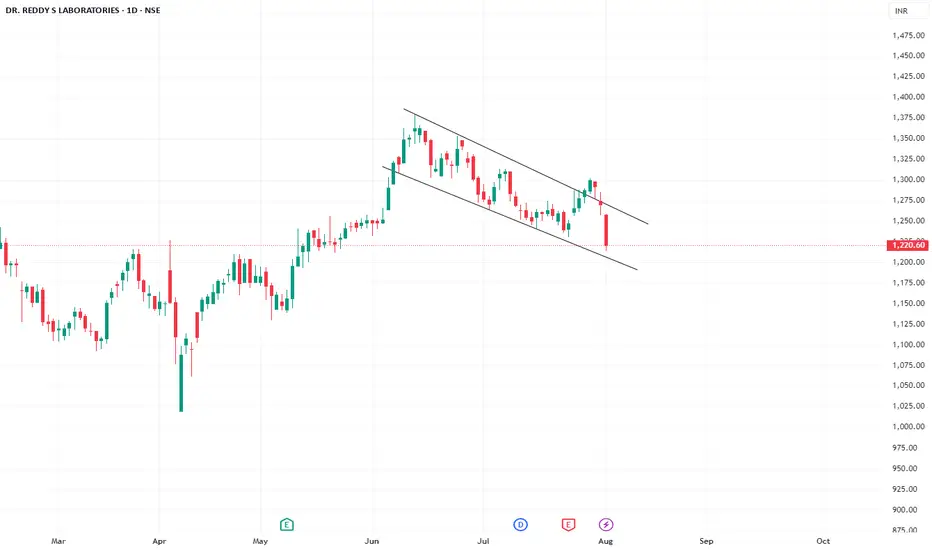
CMP (Current Market Price): ₹1,220.60 ( Look for Support or breakdown on trend lines )
📝 Summary:
Dr. Reddy’s Laboratories has broken out of a falling wedge pattern on the daily chart, a classic bullish reversal setup. After weeks of narrowing price action between converging trendlines, the breakout happened with decent volume. This structure generally suggests a potential short-to-medium term upmove, especially if the breakout/breakdown is followed by a retest.
But has entered in the wedge again with a strong bearish candle , so lets respect the trend lines and plan a course of action!
📉 Technical Breakdown:
Price moved within a falling wedge between ~₹1,300 and ~₹1,170 since late June.
The wedge formed over ~30 trading sessions, respecting the upper and lower trendlines.
A breakout occurred near ₹1,225 with a strong bullish candle, closing above the upper trendline.
Volume expanded during breakout, indicating buyer interest.
RSI has turned upward from the 40–45 zone; MACD shows signs of a crossover.
🔑 Key Price Levels:
Type Level (₹)
Retest Zone 1,202 – 1,210
Immediate Resistance 1,240 – 1,245
Volume confirmation is key — look for above-average green candles.
Monitor Nifty Pharma index as a sectoral tailwind may accelerate moves.
Date: August 2, 2025
CMP (Current Market Price): ₹1,220.60 ( Look for Support or breakdown on trend lines )
📝 Summary:
Dr. Reddy’s Laboratories has broken out of a falling wedge pattern on the daily chart, a classic bullish reversal setup. After weeks of narrowing price action between converging trendlines, the breakout happened with decent volume. This structure generally suggests a potential short-to-medium term upmove, especially if the breakout/breakdown is followed by a retest.
But has entered in the wedge again with a strong bearish candle , so lets respect the trend lines and plan a course of action!
📉 Technical Breakdown:
Price moved within a falling wedge between ~₹1,300 and ~₹1,170 since late June.
The wedge formed over ~30 trading sessions, respecting the upper and lower trendlines.
A breakout occurred near ₹1,225 with a strong bullish candle, closing above the upper trendline.
Volume expanded during breakout, indicating buyer interest.
RSI has turned upward from the 40–45 zone; MACD shows signs of a crossover.
🔑 Key Price Levels:
Type Level (₹)
Retest Zone 1,202 – 1,210
Immediate Resistance 1,240 – 1,245
Volume confirmation is key — look for above-average green candles.
Monitor Nifty Pharma index as a sectoral tailwind may accelerate moves.
Declinazione di responsabilità
Le informazioni ed i contenuti pubblicati non costituiscono in alcun modo una sollecitazione ad investire o ad operare nei mercati finanziari. Non sono inoltre fornite o supportate da TradingView. Maggiori dettagli nelle Condizioni d'uso.
Declinazione di responsabilità
Le informazioni ed i contenuti pubblicati non costituiscono in alcun modo una sollecitazione ad investire o ad operare nei mercati finanziari. Non sono inoltre fornite o supportate da TradingView. Maggiori dettagli nelle Condizioni d'uso.