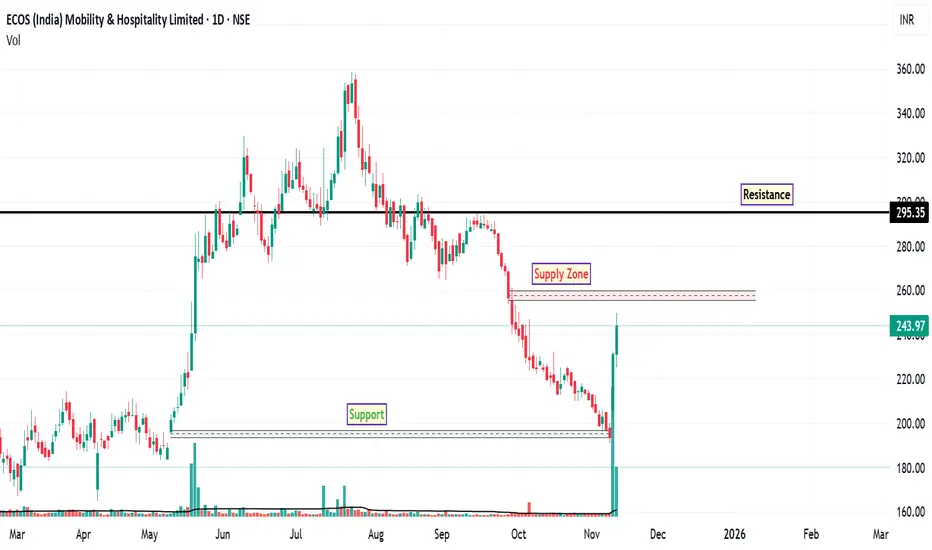
The daily chart of ECOSMOBLTY indicates early signs of a possible bullish reversal following a prolonged bearish trend. Recent price action suggests renewed buying interest, supported by multiple technical factors.
The stock has rebounded from a long-term support level near ₹191, accompanied by higher-than-average trading volume. This combination often signals increased market participation and potential trend reversal.
A bullish crossover on the MACD has been observed on the daily timeframe. This momentum-based indicator often suggests a shift from bearish to bullish sentiment when confirmed by price and volume.
The RSI has moved above 62, indicating strengthening bullish momentum. While not yet in overbought territory, this level reflects improving trend strength.
There is a notable supply zone around ₹257, which may act as an interim resistance. Price could consolidate or retrace near this level before attempting further upward movement.
Immediate Resistance: ₹257 (potential supply zone)
Major Resistance: ₹295 (historical level based on prior price action)
Support Zone: ₹191 (long-term support and invalidation level for bullish setup)
Disclaimer: This analysis is intended for educational and informational purposes only. It does not constitute investment advice or a recommendation to buy, sell, or hold any financial instrument. Market participants should conduct independent research and consult with a licensed financial advisor before making any investment decisions.
Declinazione di responsabilità
Le informazioni e le pubblicazioni non sono intese come, e non costituiscono, consulenza o raccomandazioni finanziarie, di investimento, di trading o di altro tipo fornite o approvate da TradingView. Per ulteriori informazioni, consultare i Termini di utilizzo.
Declinazione di responsabilità
Le informazioni e le pubblicazioni non sono intese come, e non costituiscono, consulenza o raccomandazioni finanziarie, di investimento, di trading o di altro tipo fornite o approvate da TradingView. Per ulteriori informazioni, consultare i Termini di utilizzo.