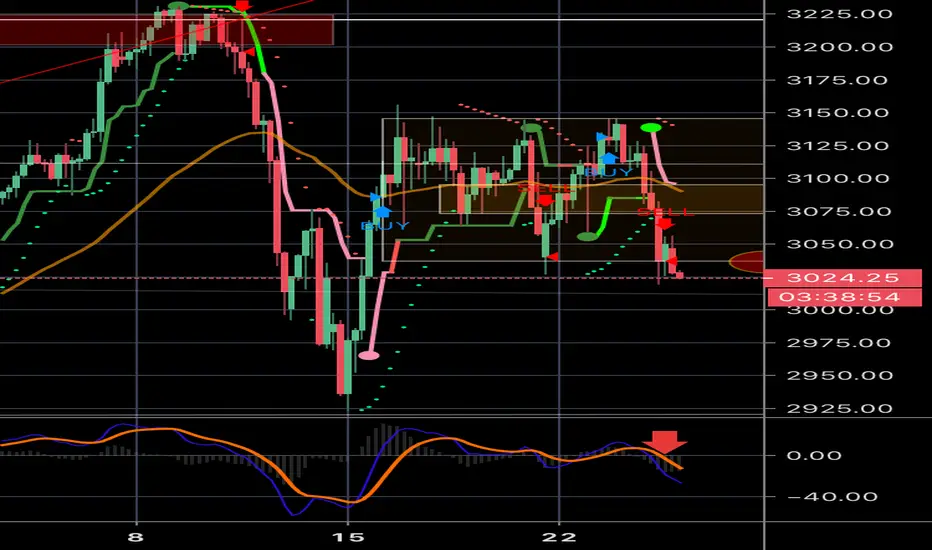
The 4H chart shows a 150 point consolidation and MACD points to deteriorating technical conditions, ripe for a breakdown soon. Perhaps a weak rebound to the 55EMA, which runs through the middle of the range like a resistance line, and then break out to the downside early next week.
See also the ES1! Daily chart for the imminent MACD crossover into bearish territory.
Clearly, 3230 was the top and a lower high formed at 3156. And breakdown out of this range puts more downside risk at play.
Watch out!
See also the ES1! Daily chart for the imminent MACD crossover into bearish territory.
Clearly, 3230 was the top and a lower high formed at 3156. And breakdown out of this range puts more downside risk at play.
Watch out!
Pubblicazioni correlate
Declinazione di responsabilità
Le informazioni ed i contenuti pubblicati non costituiscono in alcun modo una sollecitazione ad investire o ad operare nei mercati finanziari. Non sono inoltre fornite o supportate da TradingView. Maggiori dettagli nelle Condizioni d'uso.
Pubblicazioni correlate
Declinazione di responsabilità
Le informazioni ed i contenuti pubblicati non costituiscono in alcun modo una sollecitazione ad investire o ad operare nei mercati finanziari. Non sono inoltre fornite o supportate da TradingView. Maggiori dettagli nelle Condizioni d'uso.