🔎 Current Market Outlook
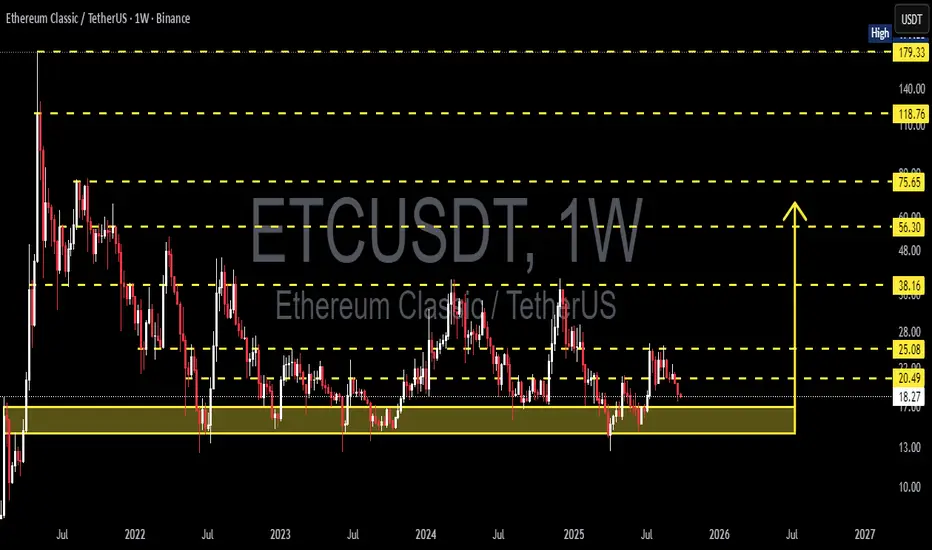
Current price: ~20.49 USDT
Price is approaching the critical support zone at 17–14 USDT (highlighted yellow).
This area has acted as a multi-year demand zone since 2021, where buyers repeatedly defended the level and triggered rebounds.
However, ETC has consistently failed to break major resistance levels, forming lower highs within a prolonged sideways range.
This makes the 17–14 zone a decision point: will buyers once again absorb supply and push for a rebound, or will sellers finally break the structure and trigger a deeper bearish trend?
---
📐 Market Structure & Price Pattern
1. Major Support Zone (17–14 USDT):
Tested multiple times since 2021.
Holding above → suggests strong accumulation.
Breaking below → could end the long-term sideways trend.
2. Key Resistance Levels:
25.08 USDT → first resistance to watch for breakout.
38.16 USDT → medium-term resistance.
56.30 & 75.65 USDT → major long-term supply zones.
Higher targets: 118.76 & 179.33 USDT (only relevant in a super bullish cycle).
3. Price Pattern:
Large sideways structure with lower highs.
Repeated tests of 17–14 → showing this demand zone is still crucial for market direction.
---
🐂 Bullish Scenario (If Buyers Defend)
Confirmation: Weekly close above 25.08 with strong volume.
Implication: Signals a new higher high on the weekly timeframe.
Targets:
TP1 → 38.16
TP2 → 56.30
TP3 → 75.65
Key Note: As long as 17–14 holds, ETC remains in accumulation territory with potential for a strong rebound in the next bullish phase.
---
🐻 Bearish Scenario (If Sellers Break Through)
Confirmation: Weekly close below 14 USDT.
Implication: Multi-year demand zone is invalidated.
Targets: Without solid support below, price could drop towards the psychological 10 USDT level or even lower.
Warning: A breakdown here would mark the end of the long-term sideways phase and trigger a deeper bearish leg.
---
🎯 Trading Strategy & Risk Management
1. Conservative Approach:
Wait for breakout >25.08 → enter long.
Targets: 38.16–56.30.
Stop loss below 22.
2. Aggressive Approach (buy the zone):
Enter within 17–14.
Stop loss below 14.
First target 25.08, scale out at 38.16.
3. Short Setup:
Only valid if weekly close <14 (confirmed breakdown).
Short-term target: 12 → 10 USDT.
⚠️ Note: This is a high risk/reward zone. Position sizing and clear stop-loss levels are critical.
---
✨ Conclusion
The 17–14 USDT support zone is ETC’s lifeline.
Holding above → accumulation continues, with rebound potential toward 25.08 → 38.16.
Breaking below 14 → long-term bearish breakdown with risk of a sharp decline.
Breakout above 25.08 → the first real trigger of a bullish trend reversal.
ETC is at a make-or-break moment. Traders should closely watch how weekly candles react around 17–14.
---
#ETC #EthereumClassic #Crypto #Altcoins #TechnicalAnalysis #PriceAction #SwingTrade #SupportResistance #CryptoAnalysis #ChartPatterns
✅ Get Free Signals! Join Our Telegram Channel Here: t.me/TheCryptoNuclear
✅ Twitter: twitter.com/crypto_nuclear
✅ Join Bybit : partner.bybit.com/b/nuclearvip
✅ Benefits : Lifetime Trading Fee Discount -50%
✅ Twitter: twitter.com/crypto_nuclear
✅ Join Bybit : partner.bybit.com/b/nuclearvip
✅ Benefits : Lifetime Trading Fee Discount -50%
Declinazione di responsabilità
Le informazioni ed i contenuti pubblicati non costituiscono in alcun modo una sollecitazione ad investire o ad operare nei mercati finanziari. Non sono inoltre fornite o supportate da TradingView. Maggiori dettagli nelle Condizioni d'uso.