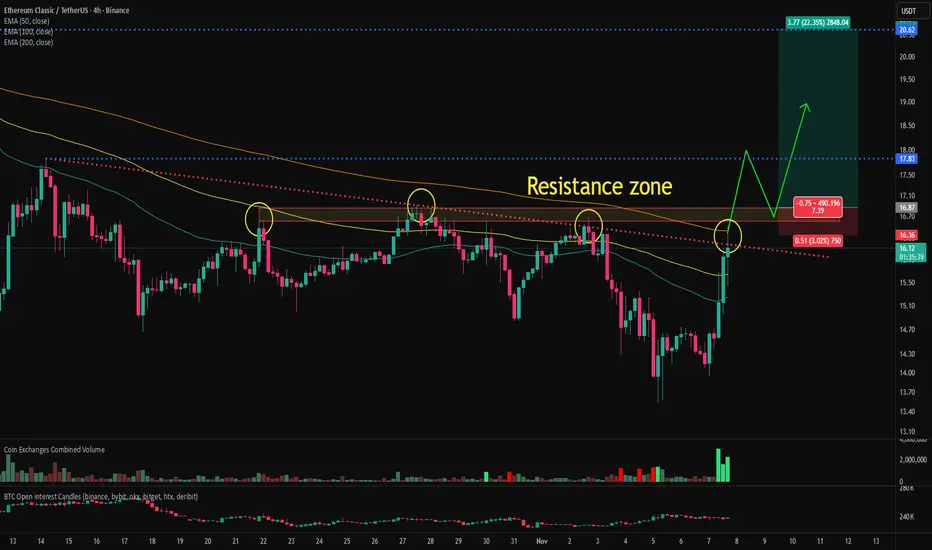
Ethereum Classic is currently attempting to break above the 200-period moving average, a key resistance level, and a major supply zone on the 4-hour chart. Although it’s facing resistance at the moment, a decisive breakout through these overlapping resistance zones could provide an attractive long-entry opportunity with a favorable risk-to-reward ratio.
Given that this resistance area has rejected multiple breakout attempts in the past, the probability of a successful breakout this time appears relatively high.
The ETC/BTC chart has also cleared several major resistance levels, suggesting that ETC could follow a similar pattern to recent strong performers such as ZEC, DASH, and 1INCH.

The bullish alignment on the ETC/BTC chart also indicates that Ethereum Classic is outperforming Bitcoin.
If Ethereum Classic confirms a breakout above the resistance zone, I will share an updated analysis on the subsequent price outlook.
Given that this resistance area has rejected multiple breakout attempts in the past, the probability of a successful breakout this time appears relatively high.
The ETC/BTC chart has also cleared several major resistance levels, suggesting that ETC could follow a similar pattern to recent strong performers such as ZEC, DASH, and 1INCH.
The bullish alignment on the ETC/BTC chart also indicates that Ethereum Classic is outperforming Bitcoin.
If Ethereum Classic confirms a breakout above the resistance zone, I will share an updated analysis on the subsequent price outlook.
Trade attivo
It's right before breaking through the resistance zone.Nota
A stronger-than-expected rally has occurred, showing clear signs of solid buying pressure on ETC. The previous key resistance zone is now likely to act as a strong support level, and if the price retraces toward this support area, it could present an attractive opportunity for a long position.I’ll provide an update if further movement occurs.
Follow me to get notified as soon as new analyses are posted.
support level
Trade chiuso: obiettivo raggiunto
Having reached the support zone, I am now executing the first of three planned partial entries for a long position.
Crypto trader. Scalping, counter-trend trading.
Check out my profile for more useful indicators.
Introduction to Bitcoin Chart Analysis and Indicators.
Youtube : youtube.com/@mensascalper
Check out my profile for more useful indicators.
Introduction to Bitcoin Chart Analysis and Indicators.
Youtube : youtube.com/@mensascalper
Declinazione di responsabilità
Le informazioni ed i contenuti pubblicati non costituiscono in alcun modo una sollecitazione ad investire o ad operare nei mercati finanziari. Non sono inoltre fornite o supportate da TradingView. Maggiori dettagli nelle Condizioni d'uso.