Trend/Pattern
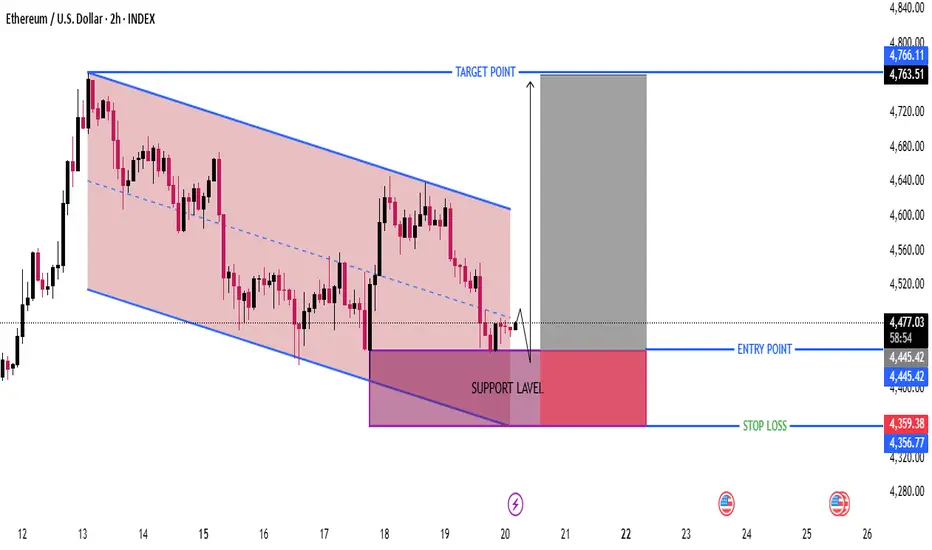
The price has been trading within a descending channel, shown by the red zone and two parallel blue trend lines.
Currently, price action is near the lower boundary of the channel, indicating potential trend exhaustion and a reversal zone.
🟣 Support Level
Marked clearly in the purple shaded region (~$4,356 to $4,445).
Price has tested this support multiple times, showing strong buying interest.
This zone acts as a demand area, and the chart suggests it might hold for a bounce back.
📈 Entry Point
$4,445.42 is the suggested long entry.
This is slightly above the current price ($4,477.92), meaning the setup might already be in play or close to triggering.
The logic: Wait for confirmation above the support before entering.
🛑 Stop Loss
$4,359.38 is the suggested stop loss (below the support).
This gives a tight risk margin, minimizing losses if the setup fails.
It's placed just under the recent lows to avoid stop hunts.
🎯 Target Point
$4,766.11 is the profit target, based on the previous resistance and top of the descending channel.
Represents a return to the upper boundary of the larger trend.
This implies a Risk:Reward Ratio (RRR) of approximately 3:1, which is favorable.
⚖️ Risk-Reward Evaluation
Entry: $4,445.42
Stop Loss: $4,359.38 → Risk = $86.04
Target: $4,766.11 → Reward = $320.69
Risk/Reward Ratio: ~3.7:1 — Excellent RRR
📊 Summary: Trading Idea
Element Value
Trade Type Long (Buy)
Entry Point $4,445.42
Stop Loss $4,359.38
Target Point $4,766.11
Risk/Reward ~3.7:1
Confirmation Needed? Yes – Watch for break and close above $4,445
✅ Pros of the Setup
Strong demand zone bounce
Clean descending channel structure
Tight stop loss, good RRR
Potential breakout from the channel
⚠️ Risks
If price breaks below support, pattern fails.
Short-term volatility could fake out breakout.
Wait for volume confirmation and/or a bullish candlestick pattern for safer entry.
join my telegram channel t.me/goldmitalteamhttps://t.me/goldmitalteam
Declinazione di responsabilità
Le informazioni ed i contenuti pubblicati non costituiscono in alcun modo una sollecitazione ad investire o ad operare nei mercati finanziari. Non sono inoltre fornite o supportate da TradingView. Maggiori dettagli nelle Condizioni d'uso.