Technical Analysis – ETH/USDT (Daily Time Frame)
Chart Date: June 13, 2025
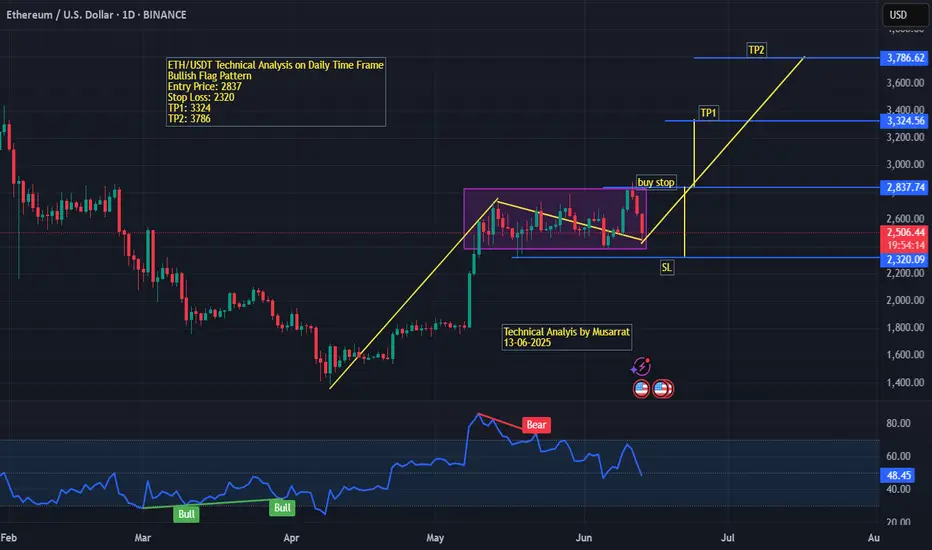
Pattern: Bullish Flag
Ethereum (ETH) against USDT is currently forming a bullish flag pattern on the daily chart, indicating a potential continuation of the previous uptrend. The price action shows a sharp bullish rally followed by a consolidation phase within a descending channel (flag), which is typical in such setups.
Entry Point: The breakout level is marked at $2,837, which serves as a potential buy-stop trigger.
Stop Loss (SL): Placed at $2,320, just below the support zone and the lower boundary of the consolidation flag. This helps protect against a false breakout.
Target 1 (TP1): $3,324, derived from the height of the flagpole projected from the breakout point.
Target 2 (TP2): $3,786, a more aggressive upside target in line with the full measured move of the flag pattern.
The RSI indicator at the bottom reflects a bearish divergence during the latter part of the flag, which led to the current retracement. However, previous bullish divergences in March and April triggered strong upswings, indicating that momentum could return if price breaks above resistance.
The price currently trades at $2,522, below the breakout level, suggesting traders should wait for confirmation of the breakout before entering the trade.
Conclusion:
This chart sets up a high-probability bullish continuation trade. Traders should monitor for a strong breakout above $2,837 with volume confirmation before entering long. Risk management is key, with a tight SL near $2,320 and clear profit-taking zones at TP1 and TP2.
Chart Date: June 13, 2025
Pattern: Bullish Flag
Ethereum (ETH) against USDT is currently forming a bullish flag pattern on the daily chart, indicating a potential continuation of the previous uptrend. The price action shows a sharp bullish rally followed by a consolidation phase within a descending channel (flag), which is typical in such setups.
Entry Point: The breakout level is marked at $2,837, which serves as a potential buy-stop trigger.
Stop Loss (SL): Placed at $2,320, just below the support zone and the lower boundary of the consolidation flag. This helps protect against a false breakout.
Target 1 (TP1): $3,324, derived from the height of the flagpole projected from the breakout point.
Target 2 (TP2): $3,786, a more aggressive upside target in line with the full measured move of the flag pattern.
The RSI indicator at the bottom reflects a bearish divergence during the latter part of the flag, which led to the current retracement. However, previous bullish divergences in March and April triggered strong upswings, indicating that momentum could return if price breaks above resistance.
The price currently trades at $2,522, below the breakout level, suggesting traders should wait for confirmation of the breakout before entering the trade.
Conclusion:
This chart sets up a high-probability bullish continuation trade. Traders should monitor for a strong breakout above $2,837 with volume confirmation before entering long. Risk management is key, with a tight SL near $2,320 and clear profit-taking zones at TP1 and TP2.
Declinazione di responsabilità
Le informazioni ed i contenuti pubblicati non costituiscono in alcun modo una sollecitazione ad investire o ad operare nei mercati finanziari. Non sono inoltre fornite o supportate da TradingView. Maggiori dettagli nelle Condizioni d'uso.
Declinazione di responsabilità
Le informazioni ed i contenuti pubblicati non costituiscono in alcun modo una sollecitazione ad investire o ad operare nei mercati finanziari. Non sono inoltre fornite o supportate da TradingView. Maggiori dettagli nelle Condizioni d'uso.