ETH/USD (Coinbase)
Timeframe: 2-hour
Current Price: ~$3,485.73
Indicators:
Red Line: Likely a short-term moving average (e.g., 20 EMA)
Blue Line: Longer-term moving average (e.g., 50 or 100 EMA)
Pattern: A pullback toward previous support after a significant rally
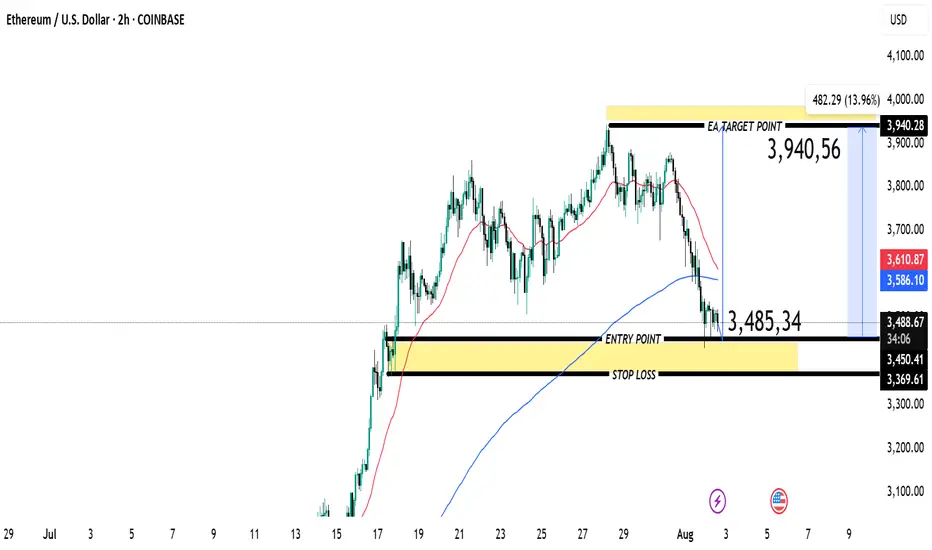
✅ Trade Setup Details
Entry Point: ~$3,485.34
This level aligns with prior consolidation and support zone (yellow highlighted area)
Stop Loss: ~$3,369.61
Placed below the support block to allow room for volatility
Target Point: ~$3,940.56
A retest of previous swing highs
✅ Risk/Reward
Potential Upside: ~13.96% move (approx. +$482)
Risk: About $115 per ETH
Reward/Risk Ratio: ~4:1
Favorable, as rewards significantly exceed the risk
✅ Technical Context
Price Action:
Recent downward retracement after peaking near $3,940
Testing a major support (highlighted in yellow)
If this support holds, there is potential for a reversal rally toward target
Moving Averages:
Price is near/below the red short-term moving average, signaling recent bearish momentum
A bounce from this zone could confirm a higher low formation
Key Confirmation:
Strong bullish candle or rejection wick from the support zone would strengthen the long bias
✅ Summary of the Setup
This chart outlines a long trade opportunity:
Entry near: $3,485
Stop below: $3,369
Target: ~$3,940
Rationale: Buying into a well-established support zone anticipating a rebound to retest prior highs.
If you’d like, I can help you:
Assess alternative targets
Discuss scaling entries
Review other timeframes for confluence
Timeframe: 2-hour
Current Price: ~$3,485.73
Indicators:
Red Line: Likely a short-term moving average (e.g., 20 EMA)
Blue Line: Longer-term moving average (e.g., 50 or 100 EMA)
Pattern: A pullback toward previous support after a significant rally
✅ Trade Setup Details
Entry Point: ~$3,485.34
This level aligns with prior consolidation and support zone (yellow highlighted area)
Stop Loss: ~$3,369.61
Placed below the support block to allow room for volatility
Target Point: ~$3,940.56
A retest of previous swing highs
✅ Risk/Reward
Potential Upside: ~13.96% move (approx. +$482)
Risk: About $115 per ETH
Reward/Risk Ratio: ~4:1
Favorable, as rewards significantly exceed the risk
✅ Technical Context
Price Action:
Recent downward retracement after peaking near $3,940
Testing a major support (highlighted in yellow)
If this support holds, there is potential for a reversal rally toward target
Moving Averages:
Price is near/below the red short-term moving average, signaling recent bearish momentum
A bounce from this zone could confirm a higher low formation
Key Confirmation:
Strong bullish candle or rejection wick from the support zone would strengthen the long bias
✅ Summary of the Setup
This chart outlines a long trade opportunity:
Entry near: $3,485
Stop below: $3,369
Target: ~$3,940
Rationale: Buying into a well-established support zone anticipating a rebound to retest prior highs.
If you’d like, I can help you:
Assess alternative targets
Discuss scaling entries
Review other timeframes for confluence
Join my telegram (COPY_TRADE)
t.me/+4ns23-AkD5RmM2Q0
t.me/+4ns23-AkD5RmM2Q0
Join my refrel broker link
one.exnesstrack.org/a/l1t1rf3p6v
t.me/+4ns23-AkD5RmM2Q0
t.me/+4ns23-AkD5RmM2Q0
Join my refrel broker link
one.exnesstrack.org/a/l1t1rf3p6v
Declinazione di responsabilità
Le informazioni ed i contenuti pubblicati non costituiscono in alcun modo una sollecitazione ad investire o ad operare nei mercati finanziari. Non sono inoltre fornite o supportate da TradingView. Maggiori dettagli nelle Condizioni d'uso.