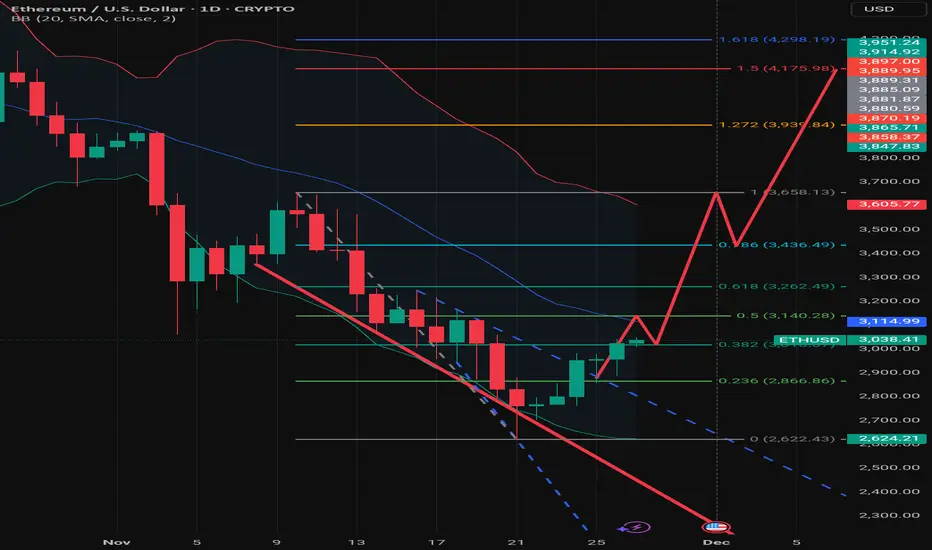
The asset has been in a downtrend (evidenced by the steep drop from the $3,658 high), but it is currently staging a sharp reversal/relief rally.
Fibonacci Retracement Analysis
The chart uses a Fibonacci retracement drawn from the high of ~$3,658 to the low of ~$2,622.
Current Battle (0.382 Level): The price is currently testing the 0.382 Fib level at roughly $3,017. This is a critical zone. Breaking and closing above this level indicates that the recovery is gaining legitimate strength rather than just being a "dead cat bounce."
Immediate Resistance (0.5 Level): If the price sustains above $3,031, the next magnet is the 0.5 Fib level at $3,140.
The Golden Pocket (0.618 Level): The most significant resistance lies at $3,262. Bearish trends often reverse back down from here. A clean break above $3,262 validates a full trend reversal to the upside.
Bollinger Bands (BB)
Mean Reversion: The price had been hugging the Lower Bollinger Band (oversold territory) but has now snapped back up.
The Middle Band (Basis): The red center line (20 SMA) is sitting around $3,114. This aligns closely with the 0.5 Fibonacci level.
Technical Insight: In a downtrend, the Middle Band often acts as dynamic resistance. The price needs to reclaim this line to flip the momentum from bearish to bullish.
Momentum Indicator (Bottom Panel)
Sharp Spike: The Momentum (Mom) indicator shows a very sharp vertical spike to 2.52. This indicates a sudden, aggressive influx of buying volume or volatility. While bullish, such sharp spikes can sometimes precede a short-term cool-off or consolidation as the market digests the move.
Summary of Critical Levels
Level Type Price Significance
Resistance 1 $3,114 - $3,140 Confluence of Middle Bollinger Band and 0.5 Fib.
Resistance 2 $3,262 The 0.618 "Golden Pocket" (Major Pivot).
Resistance 3 $3,658 Previous Swing High.
Support 1 $2,866 The 0.236 Fib level.
Support 2 $2,622 The recent Swing Low (Must hold for bullish case).
Verdict
The chart shows a strong counter-trend rally. The "Red Line" scenario is an optimistic bullish reversal setup (likely an Inverse Head and Shoulders or Elliott Wave 1-2-3).
Caution: Until ETH closes a daily candle above the Middle Bollinger Band ($3,114) and the 0.618 Fib ($3,262), the macro trend technically remains bearish/neutral.
Declinazione di responsabilità
Le informazioni e le pubblicazioni non sono intese come, e non costituiscono, consulenza o raccomandazioni finanziarie, di investimento, di trading o di altro tipo fornite o approvate da TradingView. Per ulteriori informazioni, consultare i Termini di utilizzo.
Declinazione di responsabilità
Le informazioni e le pubblicazioni non sono intese come, e non costituiscono, consulenza o raccomandazioni finanziarie, di investimento, di trading o di altro tipo fornite o approvate da TradingView. Per ulteriori informazioni, consultare i Termini di utilizzo.