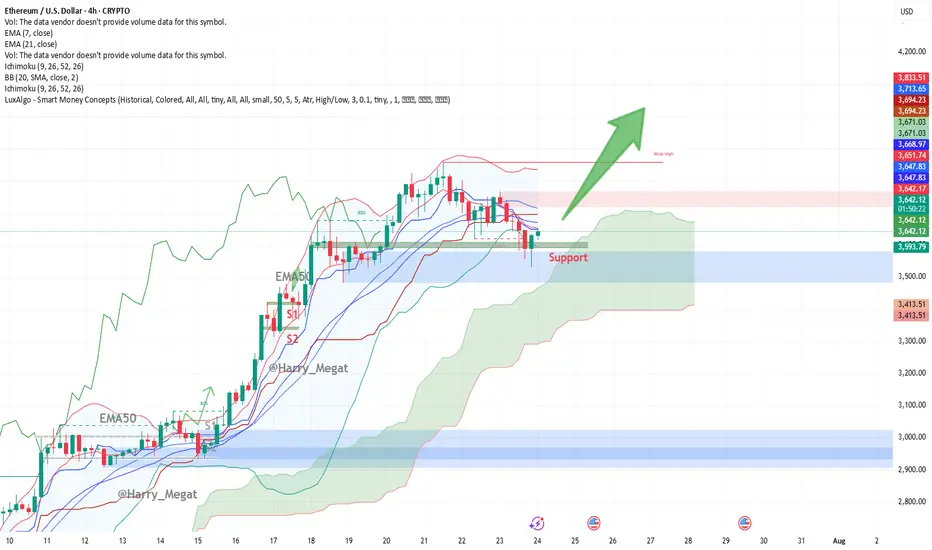
This Ethereum (ETH/USD) 4-hour chart presents a **bullish setup**. Let’s break it down:
**Chart Overview:**
* **Price at the time of chart:** \~\$3,650
* **Support Zone:** \~\$3,615–3,630 (highlighted in green box)
* **Indicators:**
* **EMA 7 (Red):** \~\$3,653.87
* **EMA 21 (Blue):** \~\$3,669.75
* **Bullish Signal:** Large upward green arrow suggests expectation of a breakout rally from current support.
**Technical Analysis:**
**1. Bullish Bounce at Support**
* ETH tested the **horizontal support zone** multiple times, showing strong demand.
* The recent candle shows a **wick rejection** from the support zone — indicating buyer strength.
**2. Moving Averages**
* Price is trying to reclaim above the **EMA7**, with EMA21 nearby (\~\$3,670).
* A **bullish crossover** or strong candle close above both EMAs could confirm upside continuation.
**3. Structure**
* Previous resistance (\~\$3,615) has turned into **new support** — a classic bullish flip.
* The large green arrow projects a **potential breakout move**, targeting higher highs possibly above **\$3,750+**, then **\$3,900+**.
**Trade Setup Idea:**
| Type | Entry | Stop Loss | Take Profit 1 | Take Profit 2 |
| Long | \$3,655–3,660 | Below \$3,600 | \$3,750 | \$3,900+ |
**Watch Out For:**
* Rejection near EMA21 (\$3,670)
* False breakout if volume is weak
* Macro risk or sudden BTC movement dragging ETH
**Conclusion:**
The chart signals a **bullish bias** if ETH maintains above the support zone and reclaims both EMAs. A clean break above \~\$3,670–3,700 could spark further upside toward \$3,900+.
Trade attivo
*ETH/USD Bullish Trade – Update***Trade Idea Recap**
| Entry Zone | Stop Loss | TP1 | TP2 |
| --------------- | ------------- | ------- | -------- |
| \$3,655–\$3,660 | Below \$3,600 | \$3,750 | \$3,900+ |
**What Happened**
* ✅ **Entered around \$3,655**
* ✅ Price surged to **\$3,738**
* 📍 **TP1 (\$3,750)** is **nearly hit**
* ✅ **Bullish breakout confirmed**
* Price above EMA 7 & 21
* Holding above \$3,700 structure
**Next Steps**
* **If holding**: Trail stop-loss to **\$3,670+**
* **Watch for TP1 at \$3,750**, then let ride toward **TP2 \$3,900+**
* **New entries**: Wait for pullback to **\$3,700–\$3,670** or breakout above \$3,750
**Bias**: Bullish continuation toward **\$3,900+** while price holds above \$3,700.
Trade chiuso: obiettivo raggiunto
*ETH/USD Trade Update– FULL WIN***Trade Idea**
* **Type**: Long
* **Entry**: \$3,655–\$3,660
* **Stop Loss**: Below \$3,600
* **Targets**:
* 🎯 **TP1**: \$3,750 ✅
* 🎯 **TP2**: \$3,900+ ✅
**Outcome**
* ETH rallied strongly from the support zone.
* Clean breakout above **EMAs and \$3,670–\$3,700 resistance**.
* Final price hit: **\$3,932** 🔥
---
### 🧠 **Key Success Factors**
* Strong support reaction (\$3,615–\$3,630)
* EMA reclaim & bullish crossover
* Structure flip and momentum follow-through
**Result**: **100% Profitable**
→ Both targets achieved. Clean technical trade.
Declinazione di responsabilità
Le informazioni ed i contenuti pubblicati non costituiscono in alcun modo una sollecitazione ad investire o ad operare nei mercati finanziari. Non sono inoltre fornite o supportate da TradingView. Maggiori dettagli nelle Condizioni d'uso.
Declinazione di responsabilità
Le informazioni ed i contenuti pubblicati non costituiscono in alcun modo una sollecitazione ad investire o ad operare nei mercati finanziari. Non sono inoltre fornite o supportate da TradingView. Maggiori dettagli nelle Condizioni d'uso.
