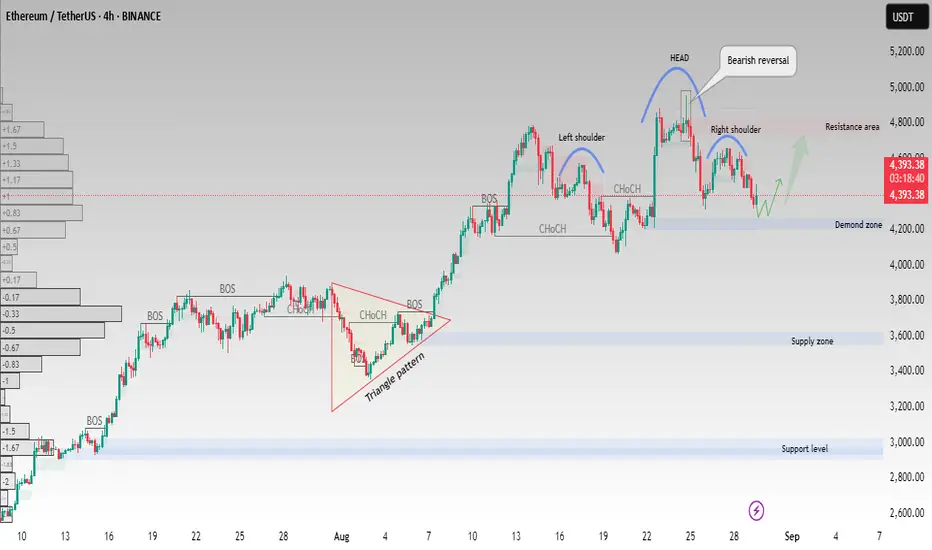
Ethereum (ETH/USDT) on the 4H timeframe is showing a Head & Shoulders pattern, which often signals a potential bearish reversal after a strong bullish move.
Pattern Observed: Head & Shoulders formation with clear Left Shoulder, Head, and Right Shoulder.
Resistance Area: Around $4,750 – $4,850, aligning with the neckline rejection.
Demand Zone: Current support seen near $4,300 – $4,350. If buyers defend this level, ETH could see a short-term rebound.
Supply Zone: Strong supply below $3,600, in case bearish momentum continues.
Possible Scenarios:
A bounce from the demand zone could push ETH back toward resistance.
A breakdown below support may trigger further downside toward the supply zone.
This setup combines BOS (Break of Structure) and CHoCH (Change of Character) signals, strengthening the bearish case in the short term.
This analysis is for educational purposes only and not financial advice. Always manage your risk before entering any trade.
Trade attivo
trade has been active ; Risk mange has properlyTrade chiuso: obiettivo raggiunto
$ FOREX / GOLD / BTC | Real Trades,Real Result | Risk-managed strategiesn &VIP Signal {My Personal Entries} Join Telegram _ Trade smater ||
📬 Join Free Channel:
t.me/profitmagnetpro12
📬 Join Free Channel:
t.me/profitmagnetpro12
Pubblicazioni correlate
Declinazione di responsabilità
Le informazioni ed i contenuti pubblicati non costituiscono in alcun modo una sollecitazione ad investire o ad operare nei mercati finanziari. Non sono inoltre fornite o supportate da TradingView. Maggiori dettagli nelle Condizioni d'uso.