Dear Traders,
Ethereum is currently in a corrective phase after a significant rally and repeated rejections from major resistance levels. The structure suggests price is approaching a critical zone that could determine ETH’s medium- to long-term direction.
Below is a full technical + fundamental + scenario-based analysis based on your chart.
🟦 1. Technical Analysis
🔹 Market Structure
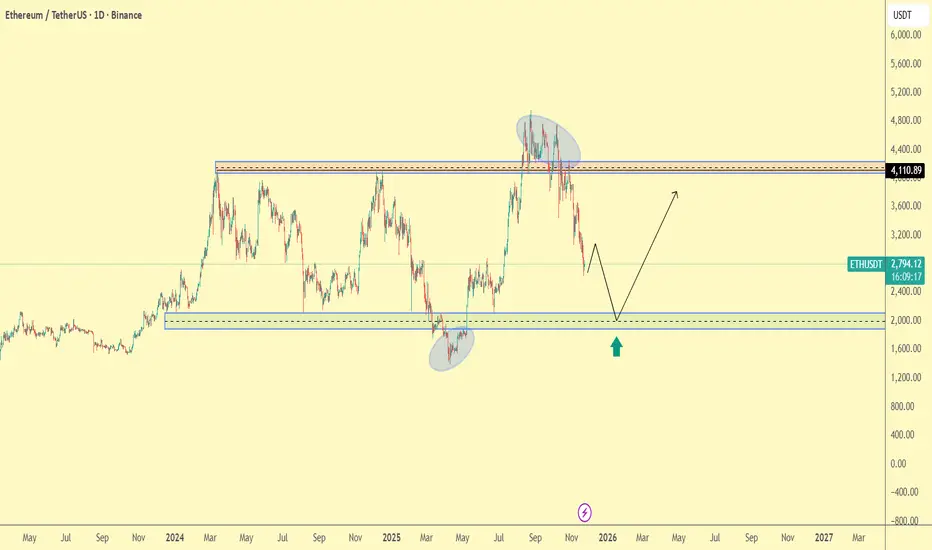
In the daily timeframe, Ethereum has rejected the major resistance area at $3,950 – $4,200, which previously acted as a local top. After failing to break above it twice, the market shifted into correction mode.
Price is now heading toward a major support zone around $1,890 – $2,150, which includes:
A strong historical demand zone
A previous accumulation area
A key horizontal support level
The region that initiated the previous uptrend
This is a macro support, tested multiple times.
🔹 Repeated Tops (Distribution Zones)
ETH formed two distribution structures around $4,100, indicating strong sell pressure.
Your marked ellipses correctly highlight areas where large players likely distributed positions.
🔹 Likely Path of Price
The chart structure suggests a high-probability scenario:
Retracement into $1,890–$2,150
Reaction or short-term bounce
Retest of broken structure or mid-range resistance
Potential start of a new upward leg
This follows the classic pattern: correction → accumulation → impulse.
🔹 Bullish Scenario
If Ethereum finds support and confirms reversal signals such as:
Bullish engulfing candles
Higher lows
Bullish BOS (Break of Structure)
RSI divergence
then a strong rally is likely.
Targets:
Target 1: $2,800 – $3,000
Target 2: ~$3,500
Target 3 (mid-term): $4,100 – $4,300
Breaking above $4,300 could open the door for a new long-term bullish cycle.
🔹 Bearish Scenario (Low Probability but Important)
If ETH loses the major support at $1,890 with strong volume:
Next support: $1,650
Deep correction target: $1,450
This scenario becomes more likely if Bitcoin enters a heavy sell-off or if macroeconomic risk increases.
🟦 2. Fundamental Analysis
Ethereum remains one of the strongest assets fundamentally, supported by real-world usage, developer activity, and network economics.
🔹 Network Upgrades (Ethereum Roadmap)
After the full transition to Proof-of-Stake and subsequent upgrades, Ethereum benefits from:
Lower issuance (near-deflationary supply)
Lower energy consumption
Higher performance
Better scalability
Upcoming improvements focus on data availability and rollup efficiency, which reduces gas fees and boosts ecosystem growth.
🔹 Growth of Layer 2 Networks
L2 ecosystems like:
Arbitrum
Optimism
Base
zkSync
Starknet
are driving massive transaction volume into Ethereum.
More L2 usage → more ETH burned → stronger long-term value.
🔹 Dominance in DeFi
Ethereum still leads the DeFi sector:
Highest TVL (Total Value Locked)
Most active protocols
Largest developer community
This creates continuous, organic demand for ETH in:
Transactions
Staking
Collateral
Smart contract execution
🔹 Staking Demand
Over 25% of Ethereum’s total supply is staked.
This reduces circulating supply, lowers sell pressure, and supports long-term price appreciation.
Institutional interest in staking continues to grow, further strengthening fundamentals.
🔹 Key Risks
Despite strong fundamentals, ETH faces these challenges:
Regulatory pressure on staking services
Correlation with Bitcoin in macro downtrends
Competition from fast L1 networks (Solana, Avalanche, Sui, etc.)
Still, Ethereum remains ahead in ecosystem maturity and security.
🟦 3. Final Summary
Ethereum is approaching one of its most important supports in the last two years.
If buyers defend the $1,890–$2,150 region, a multi-month bullish wave could begin.
🔥 Key Points
ETH is correcting into major support
Technical structure is still bullish in the bigger picture
Fundamentals remain extremely strong
L2 growth, staking, and DeFi support long-term appreciation
The main scenario is: correction → accumulation → upward continuation
Targets remain $3,000 → $3,500 → $4,300 if the support holds.
Ethereum is currently in a corrective phase after a significant rally and repeated rejections from major resistance levels. The structure suggests price is approaching a critical zone that could determine ETH’s medium- to long-term direction.
Below is a full technical + fundamental + scenario-based analysis based on your chart.
🟦 1. Technical Analysis
🔹 Market Structure
In the daily timeframe, Ethereum has rejected the major resistance area at $3,950 – $4,200, which previously acted as a local top. After failing to break above it twice, the market shifted into correction mode.
Price is now heading toward a major support zone around $1,890 – $2,150, which includes:
A strong historical demand zone
A previous accumulation area
A key horizontal support level
The region that initiated the previous uptrend
This is a macro support, tested multiple times.
🔹 Repeated Tops (Distribution Zones)
ETH formed two distribution structures around $4,100, indicating strong sell pressure.
Your marked ellipses correctly highlight areas where large players likely distributed positions.
🔹 Likely Path of Price
The chart structure suggests a high-probability scenario:
Retracement into $1,890–$2,150
Reaction or short-term bounce
Retest of broken structure or mid-range resistance
Potential start of a new upward leg
This follows the classic pattern: correction → accumulation → impulse.
🔹 Bullish Scenario
If Ethereum finds support and confirms reversal signals such as:
Bullish engulfing candles
Higher lows
Bullish BOS (Break of Structure)
RSI divergence
then a strong rally is likely.
Targets:
Target 1: $2,800 – $3,000
Target 2: ~$3,500
Target 3 (mid-term): $4,100 – $4,300
Breaking above $4,300 could open the door for a new long-term bullish cycle.
🔹 Bearish Scenario (Low Probability but Important)
If ETH loses the major support at $1,890 with strong volume:
Next support: $1,650
Deep correction target: $1,450
This scenario becomes more likely if Bitcoin enters a heavy sell-off or if macroeconomic risk increases.
🟦 2. Fundamental Analysis
Ethereum remains one of the strongest assets fundamentally, supported by real-world usage, developer activity, and network economics.
🔹 Network Upgrades (Ethereum Roadmap)
After the full transition to Proof-of-Stake and subsequent upgrades, Ethereum benefits from:
Lower issuance (near-deflationary supply)
Lower energy consumption
Higher performance
Better scalability
Upcoming improvements focus on data availability and rollup efficiency, which reduces gas fees and boosts ecosystem growth.
🔹 Growth of Layer 2 Networks
L2 ecosystems like:
Arbitrum
Optimism
Base
zkSync
Starknet
are driving massive transaction volume into Ethereum.
More L2 usage → more ETH burned → stronger long-term value.
🔹 Dominance in DeFi
Ethereum still leads the DeFi sector:
Highest TVL (Total Value Locked)
Most active protocols
Largest developer community
This creates continuous, organic demand for ETH in:
Transactions
Staking
Collateral
Smart contract execution
🔹 Staking Demand
Over 25% of Ethereum’s total supply is staked.
This reduces circulating supply, lowers sell pressure, and supports long-term price appreciation.
Institutional interest in staking continues to grow, further strengthening fundamentals.
🔹 Key Risks
Despite strong fundamentals, ETH faces these challenges:
Regulatory pressure on staking services
Correlation with Bitcoin in macro downtrends
Competition from fast L1 networks (Solana, Avalanche, Sui, etc.)
Still, Ethereum remains ahead in ecosystem maturity and security.
🟦 3. Final Summary
Ethereum is approaching one of its most important supports in the last two years.
If buyers defend the $1,890–$2,150 region, a multi-month bullish wave could begin.
🔥 Key Points
ETH is correcting into major support
Technical structure is still bullish in the bigger picture
Fundamentals remain extremely strong
L2 growth, staking, and DeFi support long-term appreciation
The main scenario is: correction → accumulation → upward continuation
Targets remain $3,000 → $3,500 → $4,300 if the support holds.
💰MY FREE FOREX CRYPTO SIGNALS TELEGRAM CHANNEL: : t.me/Alirezaktrade
Declinazione di responsabilità
Le informazioni e le pubblicazioni non sono intese come, e non costituiscono, consulenza o raccomandazioni finanziarie, di investimento, di trading o di altro tipo fornite o approvate da TradingView. Per ulteriori informazioni, consultare i Termini di utilizzo.