## 📈 Analysis of the EUR/JPY Chart Pattern
The 4-hour chart for **EUR/JPY** shows the development of two primary chart patterns, suggesting a potential future price movement:
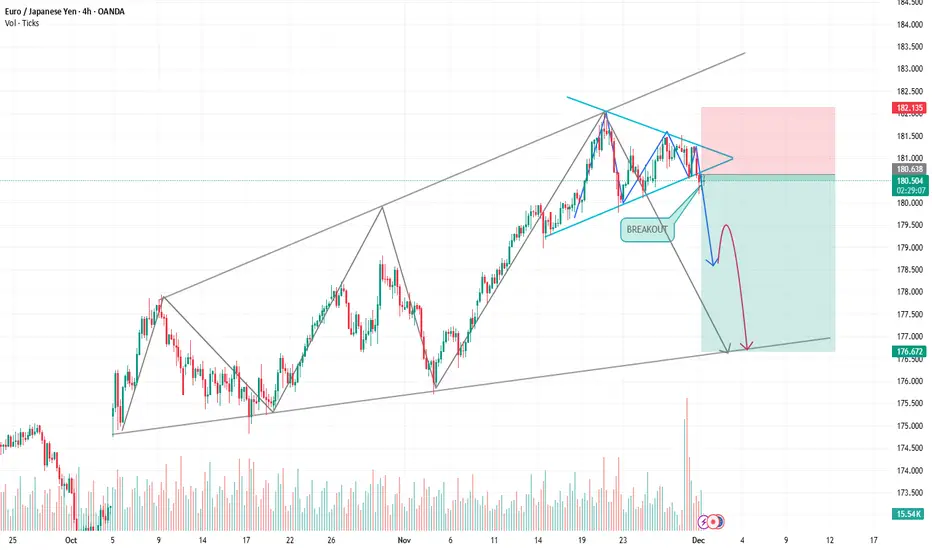
### 1. **Broadening Wedge (The Main Structure)**
The overall price action from late September to the present appears to be contained within a **Broadening Wedge** (also known as a Megaphone pattern).
* **Structure:** This pattern is characterized by two diverging trendlines (one resistance and one support) that expand over time, indicating increasing volatility and uncertainty.
* **Significance:** Broadening wedges are typically considered **reversal patterns** when they appear after a sustained move. In this case, following the overall uptrend from September, the pattern suggests the bullish momentum might be weakening, setting the stage for a reversal.
* **Projected Target:** The lowest trendline of this wedge (around **176.872**) is indicated as the ultimate potential target for the projected downward move.
### 2. **Symmetrical Triangle (The Breakout Setup)**
Immediately preceding the current candle, a smaller **Symmetrical Triangle** pattern developed.
* **Structure:** This pattern forms when price action is constrained by two converging trendlines—a lower high and a higher low—indicating a temporary pause in momentum before a continuation or reversal.
* **The Breakout:** The chart explicitly marks a **"BREAKOUT"** below the lower trendline of this symmetrical triangle.
* **Significance:** A breakout from a symmetrical triangle often signals the direction of the next significant move. The **downward breakout** suggests that sellers have taken control, confirming the pattern's indication of a move lower.
### 📉 **Trading Implications and Projection**
The chart sets up a potential **short trade** based on the confluence of the triangular breakout and the overarching broadening wedge structure:
* **Entry:** The entry appears to be placed just below the breakout area, around **180.593**.
* **Stop-Loss (Risk):** The stop-loss is placed above the recent swing high/triangle resistance at **182.125** (the shaded red area).
* **Target (Reward):** The primary target is the lower trendline of the Broadening Wedge, marked at approximately **176.872** (the shaded green area).
**In summary, the chart indicates a bearish projection for EUR/JPY, expecting the price to drop from the confirmed symmetrical triangle breakout toward the support line of the larger broadening wedge.**
Would you like me to look for any other **patterns** or **key levels** on the EUR/JPY chart?
The 4-hour chart for **EUR/JPY** shows the development of two primary chart patterns, suggesting a potential future price movement:
### 1. **Broadening Wedge (The Main Structure)**
The overall price action from late September to the present appears to be contained within a **Broadening Wedge** (also known as a Megaphone pattern).
* **Structure:** This pattern is characterized by two diverging trendlines (one resistance and one support) that expand over time, indicating increasing volatility and uncertainty.
* **Significance:** Broadening wedges are typically considered **reversal patterns** when they appear after a sustained move. In this case, following the overall uptrend from September, the pattern suggests the bullish momentum might be weakening, setting the stage for a reversal.
* **Projected Target:** The lowest trendline of this wedge (around **176.872**) is indicated as the ultimate potential target for the projected downward move.
### 2. **Symmetrical Triangle (The Breakout Setup)**
Immediately preceding the current candle, a smaller **Symmetrical Triangle** pattern developed.
* **Structure:** This pattern forms when price action is constrained by two converging trendlines—a lower high and a higher low—indicating a temporary pause in momentum before a continuation or reversal.
* **The Breakout:** The chart explicitly marks a **"BREAKOUT"** below the lower trendline of this symmetrical triangle.
* **Significance:** A breakout from a symmetrical triangle often signals the direction of the next significant move. The **downward breakout** suggests that sellers have taken control, confirming the pattern's indication of a move lower.
### 📉 **Trading Implications and Projection**
The chart sets up a potential **short trade** based on the confluence of the triangular breakout and the overarching broadening wedge structure:
* **Entry:** The entry appears to be placed just below the breakout area, around **180.593**.
* **Stop-Loss (Risk):** The stop-loss is placed above the recent swing high/triangle resistance at **182.125** (the shaded red area).
* **Target (Reward):** The primary target is the lower trendline of the Broadening Wedge, marked at approximately **176.872** (the shaded green area).
**In summary, the chart indicates a bearish projection for EUR/JPY, expecting the price to drop from the confirmed symmetrical triangle breakout toward the support line of the larger broadening wedge.**
Would you like me to look for any other **patterns** or **key levels** on the EUR/JPY chart?
Daily Forex Signals & Market Insights 📉📈
Need assistance? We're here to help! 🤝
t.me/Arthur_782
Join Our Telegram Channel Today!
t.me/+3nePmmz1xGk1MzZk
t.me/+PqiIQSFLhtEyZGU0
Need assistance? We're here to help! 🤝
t.me/Arthur_782
Join Our Telegram Channel Today!
t.me/+3nePmmz1xGk1MzZk
t.me/+PqiIQSFLhtEyZGU0
Declinazione di responsabilità
Le informazioni e le pubblicazioni non sono intese come, e non costituiscono, consulenza o raccomandazioni finanziarie, di investimento, di trading o di altro tipo fornite o approvate da TradingView. Per ulteriori informazioni, consultare i Termini di utilizzo.