Disclaimer: This analysis is for educational purposes only. I am not a SEBI-registered advisor. Please consult your financial advisor before making investment decisions.
🔎 Weekly Chart Observation
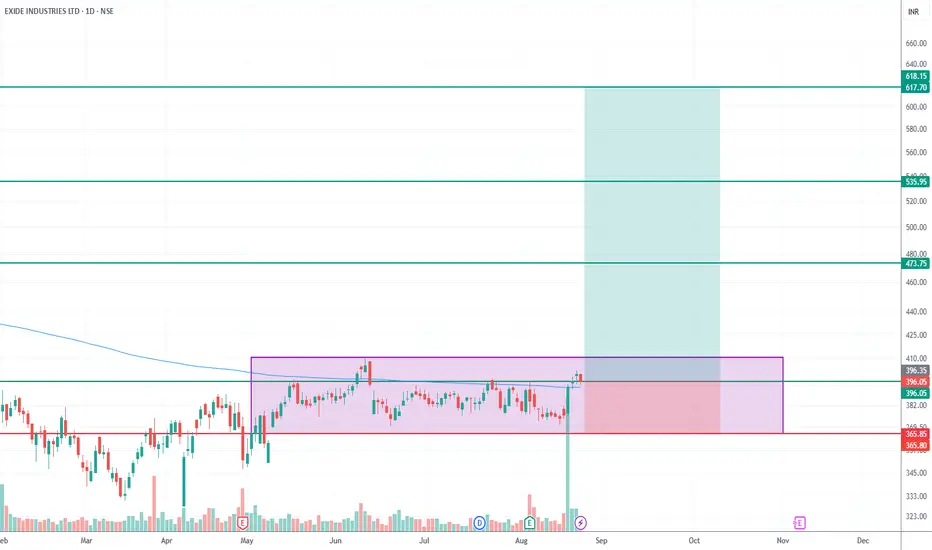
From May 12th to August, the stock consolidated between ₹365 (support) and ₹410 (resistance).
Recently, a strong bullish candle has formed on the weekly timeframe, hinting at a possible breakout.
Consolidation range: Low = 365 | High = 410.
📈 Daily Chart Confirmation
On the daily timeframe, the price has broken above the 200 EMA, showing strong momentum.
CMP: ₹396.
Stop Loss (Closing Basis): ₹365 (consolidation low).
🎯 Targets
Target 1: ₹475
Target 2: ₹535
Target 3: ₹618 (extended target, top of consolidation projection)
⚖️ Risk-Reward
Entry: ₹396
Stop Loss: ₹365
Risk–Reward Ratio ≈ 1:7.25 (for second target ₹535).
📌 Summary:
Exide Industries is exhibiting a strong weekly breakout from consolidation, supported by a daily breakout of the 200 EMA. The setup presents an excellent risk-reward opportunity, with clear targets and a well-defined stop-loss.
🔎 Weekly Chart Observation
From May 12th to August, the stock consolidated between ₹365 (support) and ₹410 (resistance).
Recently, a strong bullish candle has formed on the weekly timeframe, hinting at a possible breakout.
Consolidation range: Low = 365 | High = 410.
📈 Daily Chart Confirmation
On the daily timeframe, the price has broken above the 200 EMA, showing strong momentum.
CMP: ₹396.
Stop Loss (Closing Basis): ₹365 (consolidation low).
🎯 Targets
Target 1: ₹475
Target 2: ₹535
Target 3: ₹618 (extended target, top of consolidation projection)
⚖️ Risk-Reward
Entry: ₹396
Stop Loss: ₹365
Risk–Reward Ratio ≈ 1:7.25 (for second target ₹535).
📌 Summary:
Exide Industries is exhibiting a strong weekly breakout from consolidation, supported by a daily breakout of the 200 EMA. The setup presents an excellent risk-reward opportunity, with clear targets and a well-defined stop-loss.
Declinazione di responsabilità
Le informazioni ed i contenuti pubblicati non costituiscono in alcun modo una sollecitazione ad investire o ad operare nei mercati finanziari. Non sono inoltre fornite o supportate da TradingView. Maggiori dettagli nelle Condizioni d'uso.
Declinazione di responsabilità
Le informazioni ed i contenuti pubblicati non costituiscono in alcun modo una sollecitazione ad investire o ad operare nei mercati finanziari. Non sono inoltre fornite o supportate da TradingView. Maggiori dettagli nelle Condizioni d'uso.