FTM is in Danger of Testing Much Lower Price Ranges
FTM chart is not looking very good in the near term.
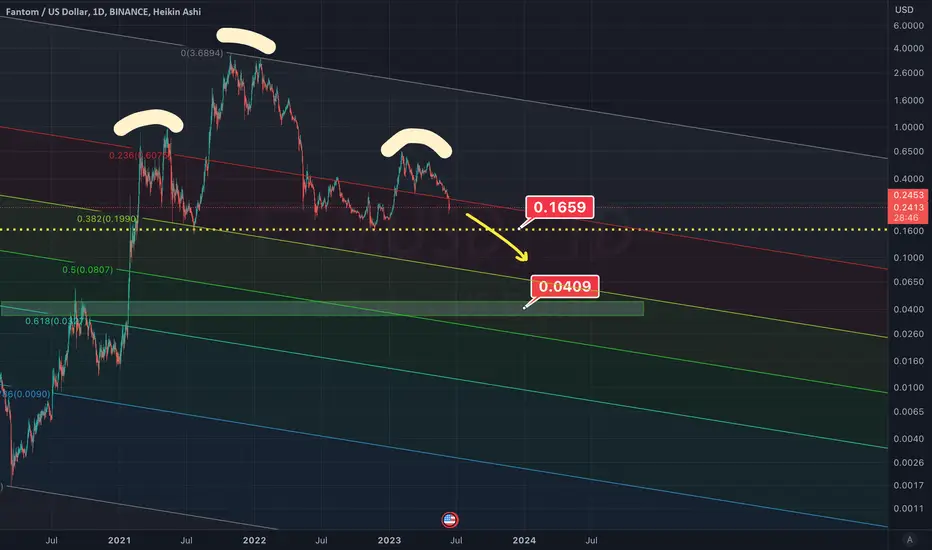
If FTM breaks below 0.20 level, it could accelerate down to 0.04 level which is aligned with the 0.618 golden pocket.
FTM is also forming a head and shoulders pattern and if it breaks the neck line of 0.1660 the price target for that is also right below 0.04.
If FTM breaks below 0.20 level, it could accelerate down to 0.04 level which is aligned with the 0.618 golden pocket.
FTM is also forming a head and shoulders pattern and if it breaks the neck line of 0.1660 the price target for that is also right below 0.04.
E.O. Breakers
@cryptowhenlambo
linktr.ee/cryptobreakers
patreon.com/CryptoWhenLambo
@cryptowhenlambo
linktr.ee/cryptobreakers
patreon.com/CryptoWhenLambo
Declinazione di responsabilità
Le informazioni e le pubblicazioni non sono intese come, e non costituiscono, consulenza o raccomandazioni finanziarie, di investimento, di trading o di altro tipo fornite o approvate da TradingView. Per ulteriori informazioni, consultare i Termini di utilizzo.