hey all! How are you doing?
Date: October 24, 2025
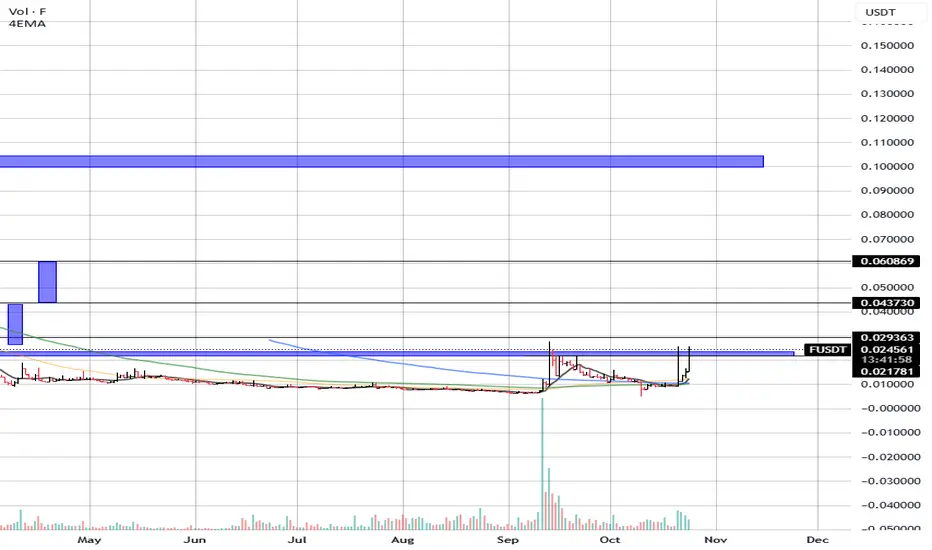
After months of sideways movement and low volatility, F is showing early signs of a potential trend reversal. The token is testing a key resistance level that has capped price since May, and a breakout from this area could open the door to a more sustained recovery phase.
🔍 Technical Overview:
Current Price: $0.0252
4EMA: $0.0122
👉 The price remains well above the short-term EMA, indicating growing bullish momentum.
📊 Market Structure:
F has spent several months forming a wide accumulation range between $0.0100 – $0.0200 (blue zone).
The recent surge in both price and volume suggests renewed interest and accumulation by buyers.
Price is now attempting to break above the $0.029 zone, a crucial structural level that could flip from resistance to support if the move holds.
📉 Support Levels:
$0.0217 → Immediate local support.
$0.0178 → Mid-range support; potential retest level if price pulls back.
$0.0100 → Major accumulation base and invalidation level.
📈 Resistance Levels / Targets:
$0.0293 → Current breakout resistance.
$0.0437 → Next major target aligned with previous local high.
$0.0608 → Larger structural resistance and potential breakout objective.
$0.1100 → Extended target area based on the measured move projection from the base structure.
📊 Volume & Momentum Notes:
The volume expansion seen during the recent move signals a shift in market dynamics, likely the beginning of trend rotation.
The RSI (not visible here but inferred from price structure) likely shows a healthy upward momentum, still below extreme overbought zones.
If price successfully consolidates above $0.025, it would confirm a structural breakout with room for continuation.
🎯 Creative Bullish Scenario:
F looks poised for a potential multi-leg breakout, emerging from a long-term accumulation range.
If the current momentum holds, a short-term rally toward $0.043 – $0.060 is plausible, with the possibility of a larger swing toward $0.110 as liquidity returns and traders re-engage with the asset.
This setup resembles a “spring and expansion” pattern, where a long base builds energy before an impulsive move.
📉 Invalidation:
A close back below $0.0178 would suggest a failed breakout and potential re-entry into the accumulation zone.
⚡ Summary:
F/USDT is showing promising early signs of a trend reversal.
A confirmed breakout above $0.0293 could mark the beginning of a medium-term bullish phase with upside targets at $0.0437 → $0.0608 → $0.1100.
As long as the price holds above $0.0217, the bullish outlook remains valid.
good trading!!
Date: October 24, 2025
After months of sideways movement and low volatility, F is showing early signs of a potential trend reversal. The token is testing a key resistance level that has capped price since May, and a breakout from this area could open the door to a more sustained recovery phase.
🔍 Technical Overview:
Current Price: $0.0252
4EMA: $0.0122
👉 The price remains well above the short-term EMA, indicating growing bullish momentum.
📊 Market Structure:
F has spent several months forming a wide accumulation range between $0.0100 – $0.0200 (blue zone).
The recent surge in both price and volume suggests renewed interest and accumulation by buyers.
Price is now attempting to break above the $0.029 zone, a crucial structural level that could flip from resistance to support if the move holds.
📉 Support Levels:
$0.0217 → Immediate local support.
$0.0178 → Mid-range support; potential retest level if price pulls back.
$0.0100 → Major accumulation base and invalidation level.
📈 Resistance Levels / Targets:
$0.0293 → Current breakout resistance.
$0.0437 → Next major target aligned with previous local high.
$0.0608 → Larger structural resistance and potential breakout objective.
$0.1100 → Extended target area based on the measured move projection from the base structure.
📊 Volume & Momentum Notes:
The volume expansion seen during the recent move signals a shift in market dynamics, likely the beginning of trend rotation.
The RSI (not visible here but inferred from price structure) likely shows a healthy upward momentum, still below extreme overbought zones.
If price successfully consolidates above $0.025, it would confirm a structural breakout with room for continuation.
🎯 Creative Bullish Scenario:
F looks poised for a potential multi-leg breakout, emerging from a long-term accumulation range.
If the current momentum holds, a short-term rally toward $0.043 – $0.060 is plausible, with the possibility of a larger swing toward $0.110 as liquidity returns and traders re-engage with the asset.
This setup resembles a “spring and expansion” pattern, where a long base builds energy before an impulsive move.
📉 Invalidation:
A close back below $0.0178 would suggest a failed breakout and potential re-entry into the accumulation zone.
⚡ Summary:
F/USDT is showing promising early signs of a trend reversal.
A confirmed breakout above $0.0293 could mark the beginning of a medium-term bullish phase with upside targets at $0.0437 → $0.0608 → $0.1100.
As long as the price holds above $0.0217, the bullish outlook remains valid.
good trading!!
Declinazione di responsabilità
Le informazioni ed i contenuti pubblicati non costituiscono in alcun modo una sollecitazione ad investire o ad operare nei mercati finanziari. Non sono inoltre fornite o supportate da TradingView. Maggiori dettagli nelle Condizioni d'uso.
Declinazione di responsabilità
Le informazioni ed i contenuti pubblicati non costituiscono in alcun modo una sollecitazione ad investire o ad operare nei mercati finanziari. Non sono inoltre fornite o supportate da TradingView. Maggiori dettagli nelle Condizioni d'uso.