📊 Key Technical Indicators
Relative Strength Index (RSI): Approximately 58.89, indicating a neutral to bullish momentum.
Moving Average Convergence Divergence (MACD): Around 0.58, suggesting a bullish trend.
Simple Moving Averages (SMA):
5-Day: ₹179.11
50-Day: ₹177.17
200-Day: ₹177.3
These values indicate a bullish sentiment, as the stock is trading above these averages.
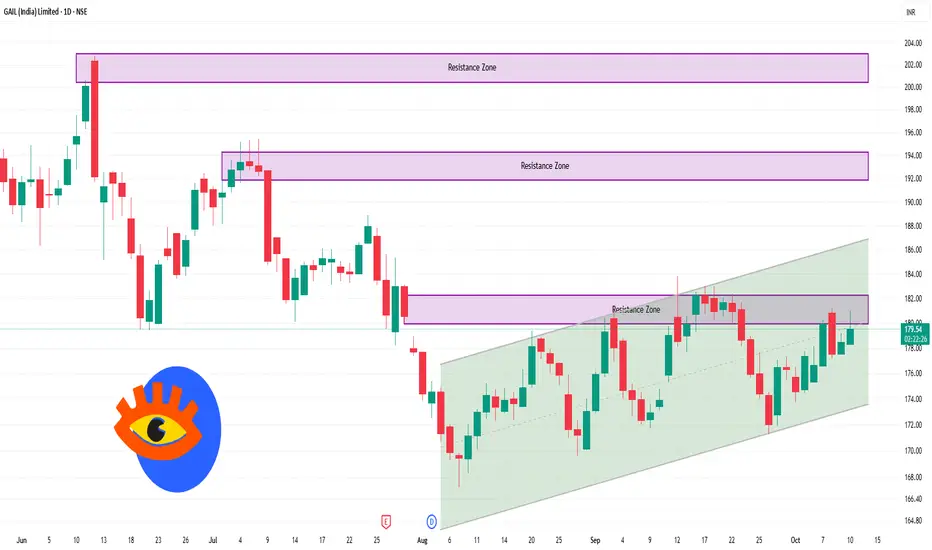
📈 Support and Resistance Levels
Immediate Support: ₹177.20
Immediate Resistance: ₹182.50
A breakout above ₹182.50 could signal a continuation of the uptrend, while a fall below ₹177.20 might indicate a bearish reversal.
🧭 Summary
GAIL (India) Ltd. is currently in a neutral to bullish phase on the daily chart. Key indicators like RSI and MACD support this outlook, and the ascending triangle pattern suggests potential upward momentum. However, traders should monitor the support and resistance levels closely to assess the next move.
Relative Strength Index (RSI): Approximately 58.89, indicating a neutral to bullish momentum.
Moving Average Convergence Divergence (MACD): Around 0.58, suggesting a bullish trend.
Simple Moving Averages (SMA):
5-Day: ₹179.11
50-Day: ₹177.17
200-Day: ₹177.3
These values indicate a bullish sentiment, as the stock is trading above these averages.
📈 Support and Resistance Levels
Immediate Support: ₹177.20
Immediate Resistance: ₹182.50
A breakout above ₹182.50 could signal a continuation of the uptrend, while a fall below ₹177.20 might indicate a bearish reversal.
🧭 Summary
GAIL (India) Ltd. is currently in a neutral to bullish phase on the daily chart. Key indicators like RSI and MACD support this outlook, and the ascending triangle pattern suggests potential upward momentum. However, traders should monitor the support and resistance levels closely to assess the next move.
Pubblicazioni correlate
Declinazione di responsabilità
Le informazioni e le pubblicazioni non sono intese come, e non costituiscono, consulenza o raccomandazioni finanziarie, di investimento, di trading o di altro tipo fornite o approvate da TradingView. Per ulteriori informazioni, consultare i Termini di utilizzo.