Noted on daily GBPJPY chart:
Best Trend Angle for price action is in between 30% to 45%, if price is above 45% trend is too strong and if price is below 30% trend is too week.
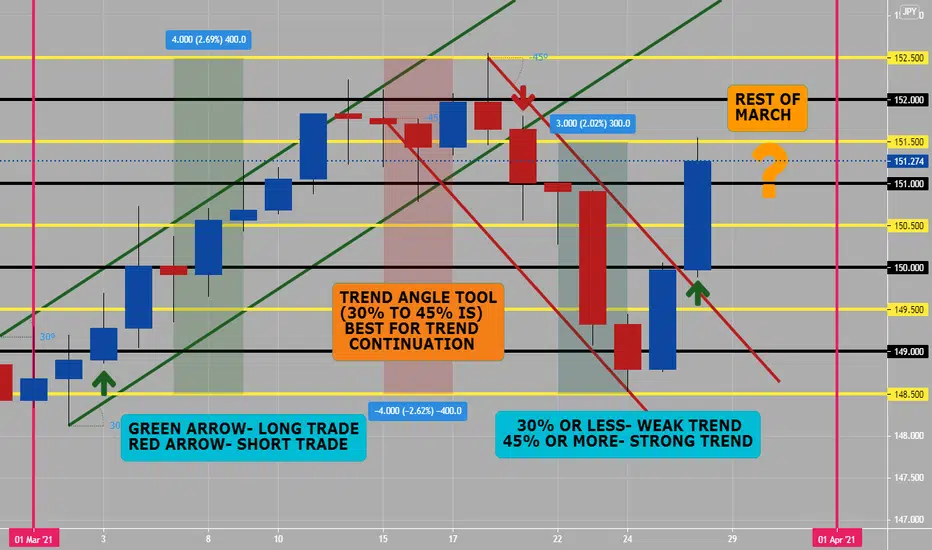
This month GJ has shown: three major trends
1) 1st major trend was a buy trend for almost three weeks and stayed above 30% trend angle- weak but still bullish. (400 pips)
2) 2nd major trend was a sell trend which broke bullish/buy three week 30% trend angle- causing price action to turn bearish. (400 pips)
3) 3rd major trend is just happening of late and appears bullish for rest of March? (300 pips so far)
* When price action breaks below 30% with a candlestick close outside of trend speed angle is slow, consider this a signal to trade sell/bearish.
*When price action stays above 30% with candlesticks closing above the trend speed angle is right to continue to trade buy/bullish.
*When price action is above 45% with candlesticks above consider trend speed is too strong to continue, price action signals sell/bearish.
*When price action is under 45% with candlesticks under consider trend has right trend speed to continue price action in buy/bullish.
On attached chart: GJ has had three major trends on daily, with a total of 1100 pips (that is a lot of possible pips, with right risk management).
Please use trend angle on any two or more price action points on charts from lower to higher time frames. You will be surprised how they help you.
Best Trend Angle for price action is in between 30% to 45%, if price is above 45% trend is too strong and if price is below 30% trend is too week.
This month GJ has shown: three major trends
1) 1st major trend was a buy trend for almost three weeks and stayed above 30% trend angle- weak but still bullish. (400 pips)
2) 2nd major trend was a sell trend which broke bullish/buy three week 30% trend angle- causing price action to turn bearish. (400 pips)
3) 3rd major trend is just happening of late and appears bullish for rest of March? (300 pips so far)
* When price action breaks below 30% with a candlestick close outside of trend speed angle is slow, consider this a signal to trade sell/bearish.
*When price action stays above 30% with candlesticks closing above the trend speed angle is right to continue to trade buy/bullish.
*When price action is above 45% with candlesticks above consider trend speed is too strong to continue, price action signals sell/bearish.
*When price action is under 45% with candlesticks under consider trend has right trend speed to continue price action in buy/bullish.
On attached chart: GJ has had three major trends on daily, with a total of 1100 pips (that is a lot of possible pips, with right risk management).
Please use trend angle on any two or more price action points on charts from lower to higher time frames. You will be surprised how they help you.
Declinazione di responsabilità
Le informazioni ed i contenuti pubblicati non costituiscono in alcun modo una sollecitazione ad investire o ad operare nei mercati finanziari. Non sono inoltre fornite o supportate da TradingView. Maggiori dettagli nelle Condizioni d'uso.
Declinazione di responsabilità
Le informazioni ed i contenuti pubblicati non costituiscono in alcun modo una sollecitazione ad investire o ad operare nei mercati finanziari. Non sono inoltre fornite o supportate da TradingView. Maggiori dettagli nelle Condizioni d'uso.