Technical Analysis – Daily Chart Overview
🔷 Pattern Structure: Symmetrical Triangle Breakout
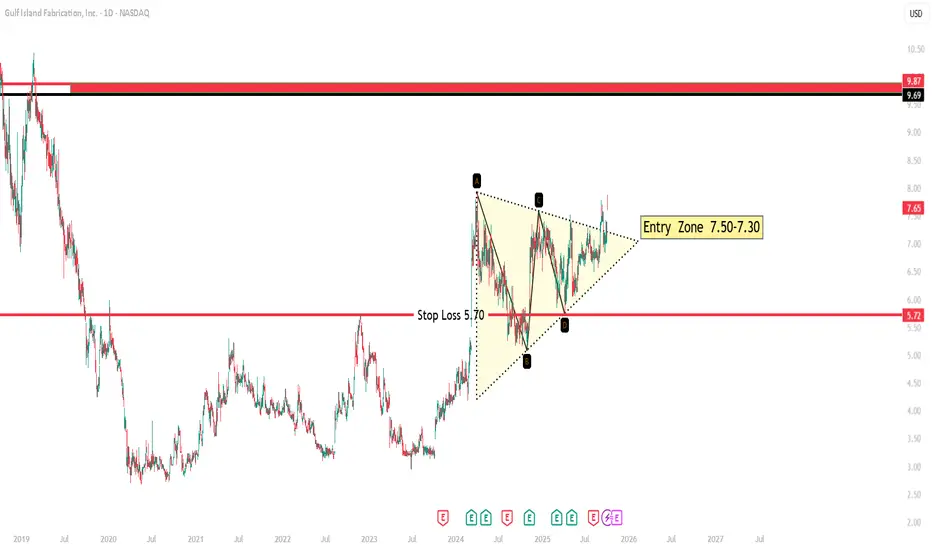
The stock has formed a symmetrical triangle pattern, marked by points A-B-C-D, typically signaling a continuation or breakout move.
The recent breakout above the triangle's resistance trendline indicates a bullish momentum shift.
🟨 Entry Zone: $7.30 – $7.50
Price is currently in the highlighted entry zone, which aligns closely with the triangle breakout level.
This area offers a high-probability entry for traders looking to catch a move early after consolidation.
The volume confirmation (not shown but assumed based on pattern behavior) would strengthen this breakout’s reliability.
📉 Stop Loss: $5.70
A logical stop-loss level is placed below the recent swing low and the lower triangle support.
$5.70 marks invalidation of the bullish structure, minimizing downside risk if the breakout fails.
This also protects against a false breakout or retest failure.
🎯 Target Zone: $9.69 – $9.87
The next significant resistance level lies in the range of $9.69 to $9.87, a strong supply zone from 2018–2019.
If momentum continues, price could revisit this zone, offering a potential upside of ~28%–32% from current levels.
🔧 Technical Summary
Component Level/Zone Observation
Pattern Symmetrical Triangle Breakout confirms bullish bias
Entry Zone $7.30 – $7.50 Ideal buy zone after breakout
Stop Loss $5.70 Below pattern low – risk management level
Target Zone $9.69 – $9.87 Previous major resistance – potential profit area
Bias Bullish Post-breakout structure with volume confirmation
📌 Conclusion
Gulf Island Fabrication (GIFI) is showing strong bullish signs after a textbook triangle breakout, with clean support and resistance levels. The risk-to-reward ratio is favorable, especially with a tight stop and a clearly defined target zone.
This setup is suitable for swing traders or position traders looking to capitalize on medium-term momentum. Monitoring volume and price action around the $8.00 level will be key to gauging the strength of the breakout continuation.
🔷 Pattern Structure: Symmetrical Triangle Breakout
The stock has formed a symmetrical triangle pattern, marked by points A-B-C-D, typically signaling a continuation or breakout move.
The recent breakout above the triangle's resistance trendline indicates a bullish momentum shift.
🟨 Entry Zone: $7.30 – $7.50
Price is currently in the highlighted entry zone, which aligns closely with the triangle breakout level.
This area offers a high-probability entry for traders looking to catch a move early after consolidation.
The volume confirmation (not shown but assumed based on pattern behavior) would strengthen this breakout’s reliability.
📉 Stop Loss: $5.70
A logical stop-loss level is placed below the recent swing low and the lower triangle support.
$5.70 marks invalidation of the bullish structure, minimizing downside risk if the breakout fails.
This also protects against a false breakout or retest failure.
🎯 Target Zone: $9.69 – $9.87
The next significant resistance level lies in the range of $9.69 to $9.87, a strong supply zone from 2018–2019.
If momentum continues, price could revisit this zone, offering a potential upside of ~28%–32% from current levels.
🔧 Technical Summary
Component Level/Zone Observation
Pattern Symmetrical Triangle Breakout confirms bullish bias
Entry Zone $7.30 – $7.50 Ideal buy zone after breakout
Stop Loss $5.70 Below pattern low – risk management level
Target Zone $9.69 – $9.87 Previous major resistance – potential profit area
Bias Bullish Post-breakout structure with volume confirmation
📌 Conclusion
Gulf Island Fabrication (GIFI) is showing strong bullish signs after a textbook triangle breakout, with clean support and resistance levels. The risk-to-reward ratio is favorable, especially with a tight stop and a clearly defined target zone.
This setup is suitable for swing traders or position traders looking to capitalize on medium-term momentum. Monitoring volume and price action around the $8.00 level will be key to gauging the strength of the breakout continuation.
Trade attivo
achivedDeclinazione di responsabilità
Le informazioni e le pubblicazioni non sono intese come, e non costituiscono, consulenza o raccomandazioni finanziarie, di investimento, di trading o di altro tipo fornite o approvate da TradingView. Per ulteriori informazioni, consultare i Termini di utilizzo.
Declinazione di responsabilità
Le informazioni e le pubblicazioni non sono intese come, e non costituiscono, consulenza o raccomandazioni finanziarie, di investimento, di trading o di altro tipo fornite o approvate da TradingView. Per ulteriori informazioni, consultare i Termini di utilizzo.