Godrej Properties (NSE: GODREJPROP) is stabilising after a prolonged correction from the ₹3400 zone.
The stock has held key Fibonacci retracement levels and is now forming a base between ₹1900–₹2250 — a critical structure zone for trend continuation.
This behaviour is typical of strong mid-large caps that correct deeply, reset sentiment, and then rebuild a trend.
📌 Structure Highlights
📌 Key Levels to Track
Support Zones:
Resistance Zones:
₹3390–3400 (major ATH resistance)
A clean weekly close above ₹2479–2557 would unlock higher trend continuation.
📌 Technical Snapshot
✅ Holding major Fibonacci structure
✅ Trendline support intact
✅ Slow volume expansion near base
✅ Higher lows forming
✅ Recovery setup, not breakout-chasing
Bias stays neutral to bullish above ₹1916, turning stronger above ₹2221.
📌 View
The stock is in a large consolidation zone after a strong multi-year rally.
Watching for a breakout from the ₹2479–2557 supply region to confirm trend continuation.
📒 Educational market structure analysis — not investment advice.
The stock has held key Fibonacci retracement levels and is now forming a base between ₹1900–₹2250 — a critical structure zone for trend continuation.
This behaviour is typical of strong mid-large caps that correct deeply, reset sentiment, and then rebuild a trend.
📌 Structure Highlights
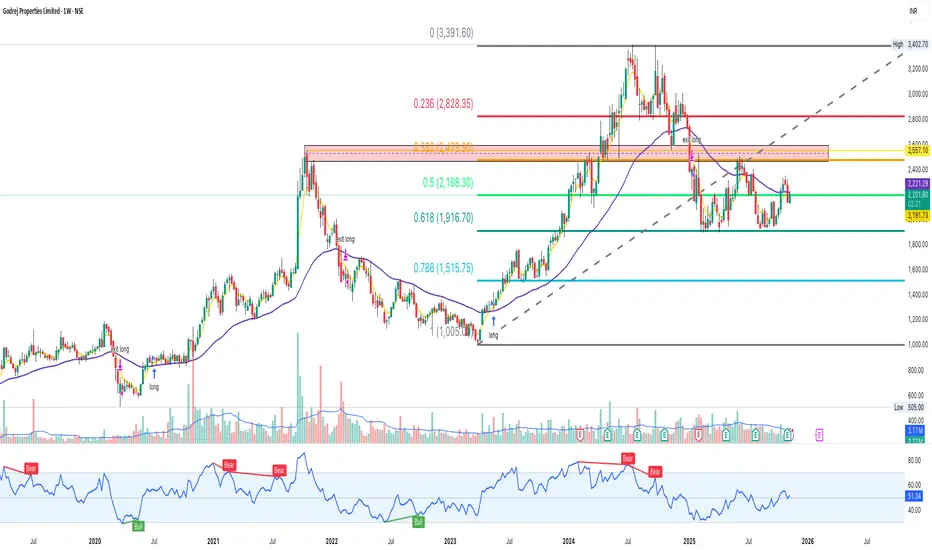
- Held 0.618 retracement (₹1916) perfectly — strong long-term support
- 0.50 level ₹2198 reclaimed → bullish sign
- Price still below major supply around ₹2479–2557 (orange box)
- Higher lows forming since the ₹1005 bottom
- Trendline support from 2023 still valid (grey dotted line)
- RSI showing slow momentum recovery after bearish cycle
📌 Key Levels to Track
Support Zones:
- ₹2190
- ₹1916 (major Fibonacci support)
- ₹1515 (0.786) — deeper trend support
Resistance Zones:
- ₹2221 (near-term resistance)
- ₹2479–2557 (strong supply zone)
- ₹2828 (0.236 retracement)
₹3390–3400 (major ATH resistance)
A clean weekly close above ₹2479–2557 would unlock higher trend continuation.
📌 Technical Snapshot
✅ Holding major Fibonacci structure
✅ Trendline support intact
✅ Slow volume expansion near base
✅ Higher lows forming
✅ Recovery setup, not breakout-chasing
Bias stays neutral to bullish above ₹1916, turning stronger above ₹2221.
📌 View
The stock is in a large consolidation zone after a strong multi-year rally.
Watching for a breakout from the ₹2479–2557 supply region to confirm trend continuation.
📒 Educational market structure analysis — not investment advice.
Declinazione di responsabilità
Le informazioni e le pubblicazioni non sono intese come, e non costituiscono, consulenza o raccomandazioni finanziarie, di investimento, di trading o di altro tipo fornite o approvate da TradingView. Per ulteriori informazioni, consultare i Termini di utilizzo.
Declinazione di responsabilità
Le informazioni e le pubblicazioni non sono intese come, e non costituiscono, consulenza o raccomandazioni finanziarie, di investimento, di trading o di altro tipo fornite o approvate da TradingView. Per ulteriori informazioni, consultare i Termini di utilizzo.