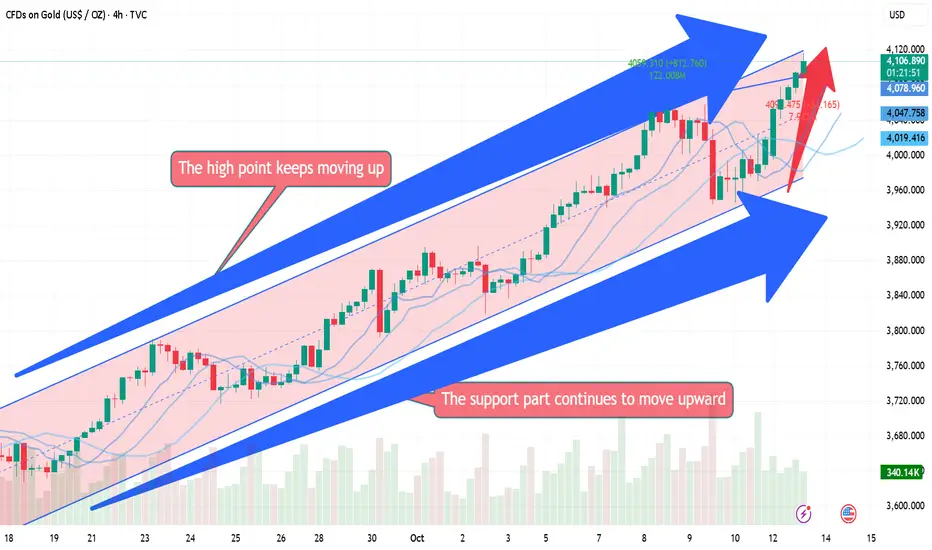
After breaking through the previous resistance band on the 4-hour chart, gold's candlestick chart continues to maintain a strong upward trend along the short-term moving average. There are still no signs of a peak in the short term, so focus on the support band around 4080. Currently, a purely technical correction in gold is unlikely to lead to a significant decline. The most likely scenario is a sudden sell-off or a rapid surge and then a decline to release bullish pressure, which may lead to some decent short-selling opportunities. On the hourly chart, the candlestick chart maintains a slight upward trend along the short-term moving average. Intraday pullbacks do not provide much room for improvement. Watch for short-term corrections in the closing market. Consider long positions around 3080-1.
Trade attivo
The market has no absolutes, nor fixed trends of ups and downs. Therefore, a balanced assessment of market fluctuations is your key to success. Let money be our loyal servant; otherwise, it will become a tyrannical master. If you have any questions about the market, please leave a message for David.Pubblicazioni correlate
Declinazione di responsabilità
Le informazioni e le pubblicazioni non sono intese come, e non costituiscono, consulenza o raccomandazioni finanziarie, di investimento, di trading o di altro tipo fornite o approvate da TradingView. Per ulteriori informazioni, consultare i Termini di utilizzo.
Pubblicazioni correlate
Declinazione di responsabilità
Le informazioni e le pubblicazioni non sono intese come, e non costituiscono, consulenza o raccomandazioni finanziarie, di investimento, di trading o di altro tipo fornite o approvate da TradingView. Per ulteriori informazioni, consultare i Termini di utilizzo.