### 🔹 Trend Structure:
1. **Overall Trend:**
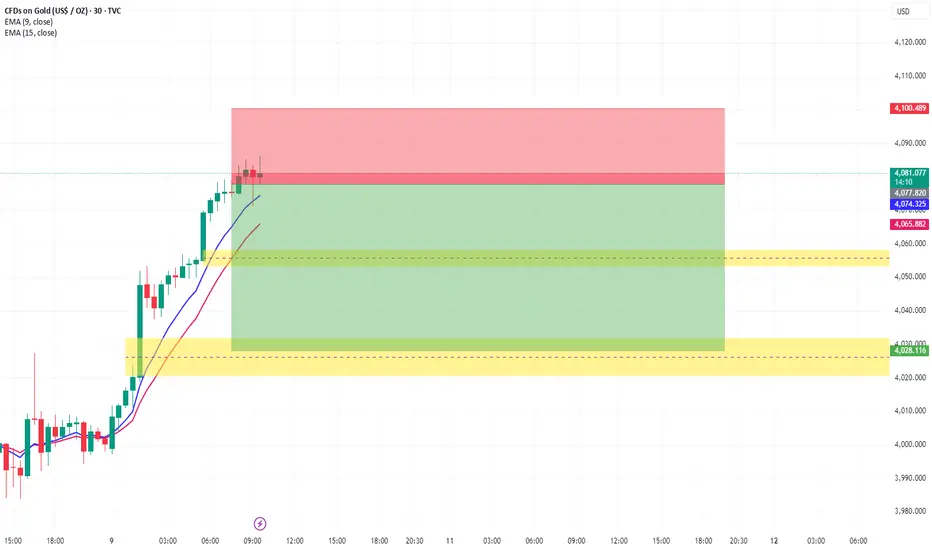
The chart shows a **strong bullish trend** before the current setup — a clear **impulse move up** with higher highs (HH) and higher lows (HL).
2. **Current Market Behavior:**
After a strong bullish leg, the price reached a **resistance zone around 4080–4090**, where you entered a **short (sell)** trade.
* The **red zone** marks your **stop-loss** (above recent highs).
* The **green zone** marks your **target area**, which aligns with a **previous demand zone** (yellow box below).
3. **Key Structures:**
* **Demand Zones (Yellow Boxes):**
These are areas where buying pressure previously pushed the market up — potential retracement or reaction zones.
* **EMA Cross (9 & 15):**
The EMAs are still pointing upward — showing **bullish momentum**, though short-term exhaustion is visible.
* **Possible Pullback Zone:**
Price might retrace to test the **first yellow zone (4055–4065)** or the **second one (4020–4030)** before resuming upward or breaking structure lower.
### 🔹 Structural Summary:
* **Main structure:** Bullish (higher timeframe).
* **Substructure (current 30m leg):** Potential **bearish correction** or **retracement** after overextension.
* **Key confirmation:** A break below **4060 (lower yellow zone)** would signal a **shift to bearish structure** on this timeframe.
Declinazione di responsabilità
Le informazioni e le pubblicazioni non sono intese come, e non costituiscono, consulenza o raccomandazioni finanziarie, di investimento, di trading o di altro tipo fornite o approvate da TradingView. Per ulteriori informazioni, consultare i Termini di utilizzo.
Declinazione di responsabilità
Le informazioni e le pubblicazioni non sono intese come, e non costituiscono, consulenza o raccomandazioni finanziarie, di investimento, di trading o di altro tipo fornite o approvate da TradingView. Per ulteriori informazioni, consultare i Termini di utilizzo.