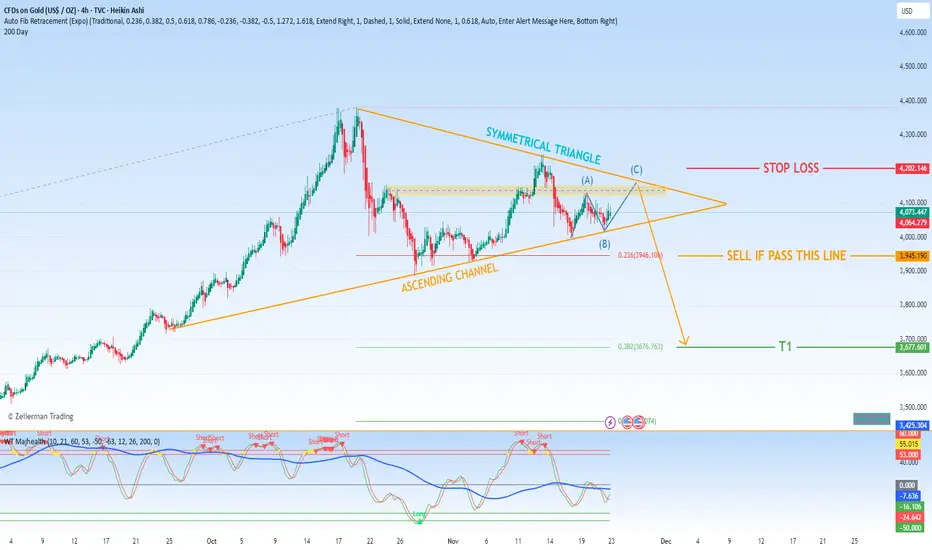
The technical chart for  GOLD is currently exhibiting a compelling and potentially powerful pattern configuration. The primary structure is an ascending channel, characterized by a consistent series of higher lows and higher highs. Contained within this broader channel, the price action has also begun to consolidate into a symmetrical triangle. This triangle is identified by converging trendlines, where the resistance is sloping downward and the support is sloping upward, creating a coil-like formation.
This pattern confluence is significant. The ascending channel provides the underlying bullish bias, while the symmetrical triangle represents a period of consolidation and equilibrium between buyers and sellers. A decisive breakout from this triangle, especially on high volume, typically signals the resumption of the prior trend and can lead to a powerful, directional move.
2. Key Technical Levels and Trade Execution Strategy
Our trading plan is built around the anticipated resolution of this symmetrical triangle.
Stop Loss (Risk Management): A stop loss is placed at 4,200. This level should be positioned logically below a key support structure, such as the lower boundary of the ascending channel or a recent significant swing low. Its purpose is to automatically exit the trade if the price action invalidates the bullish pattern, thus defining and limiting our maximum risk.
Profit-Taking Strategy (Tiered Exit):
Take Profit 1 (TP1): 3,637.763 (0.382 Fibonacci Retracement) - This is our primary profit-taking target. The 0.382 Fibonacci level is a common and respected retracement zone where one can expect some resistance during a pullback. Securing profits here locks in gains and reduces risk for the remainder of the position.
3. The Critical Trigger: Managing a Bearish Move
The analysis includes a specific contingency plan for a bearish outcome. The 0.236 Fibonacci level at 3,946.106 is not a take-profit level but a critical trigger level for action.
If the price declines and closes below 3,946.106, it serves as an early warning signal. This breach suggests that selling pressure is overcoming buying pressure and increases the probability that the price will continue to fall toward our TP1 level at 3,637.76.
Therefore, a break below 3,946.106 is the trigger that validates the sell signal and activates our profit-taking strategy at TP1.
In Summary:
The current setup forGOLD shows a bullish structure (Ascending Channel) undergoing consolidation (Symmetrical Triangle). Our base case is to wait for a bullish breakout. However, this plan specifically outlines the strategy for a bearish move:
Monitor the 0.236 Fibonacci level at 3,946.106.
If this level is broken, it triggers a sell signal.
Execute the trade with a profit target at the 0.382 Fibonacci level (3,637.76) and a stop loss at 4,200 to manage risk.
This creates a defined, rules-based approach to capitalize on a potential downward move within the broader pattern.
This pattern confluence is significant. The ascending channel provides the underlying bullish bias, while the symmetrical triangle represents a period of consolidation and equilibrium between buyers and sellers. A decisive breakout from this triangle, especially on high volume, typically signals the resumption of the prior trend and can lead to a powerful, directional move.
2. Key Technical Levels and Trade Execution Strategy
Our trading plan is built around the anticipated resolution of this symmetrical triangle.
Stop Loss (Risk Management): A stop loss is placed at 4,200. This level should be positioned logically below a key support structure, such as the lower boundary of the ascending channel or a recent significant swing low. Its purpose is to automatically exit the trade if the price action invalidates the bullish pattern, thus defining and limiting our maximum risk.
Profit-Taking Strategy (Tiered Exit):
Take Profit 1 (TP1): 3,637.763 (0.382 Fibonacci Retracement) - This is our primary profit-taking target. The 0.382 Fibonacci level is a common and respected retracement zone where one can expect some resistance during a pullback. Securing profits here locks in gains and reduces risk for the remainder of the position.
3. The Critical Trigger: Managing a Bearish Move
The analysis includes a specific contingency plan for a bearish outcome. The 0.236 Fibonacci level at 3,946.106 is not a take-profit level but a critical trigger level for action.
If the price declines and closes below 3,946.106, it serves as an early warning signal. This breach suggests that selling pressure is overcoming buying pressure and increases the probability that the price will continue to fall toward our TP1 level at 3,637.76.
Therefore, a break below 3,946.106 is the trigger that validates the sell signal and activates our profit-taking strategy at TP1.
In Summary:
The current setup for
Monitor the 0.236 Fibonacci level at 3,946.106.
If this level is broken, it triggers a sell signal.
Execute the trade with a profit target at the 0.382 Fibonacci level (3,637.76) and a stop loss at 4,200 to manage risk.
This creates a defined, rules-based approach to capitalize on a potential downward move within the broader pattern.
Declinazione di responsabilità
Le informazioni e le pubblicazioni non sono intese come, e non costituiscono, consulenza o raccomandazioni finanziarie, di investimento, di trading o di altro tipo fornite o approvate da TradingView. Per ulteriori informazioni, consultare i Termini di utilizzo.
Declinazione di responsabilità
Le informazioni e le pubblicazioni non sono intese come, e non costituiscono, consulenza o raccomandazioni finanziarie, di investimento, di trading o di altro tipo fornite o approvate da TradingView. Per ulteriori informazioni, consultare i Termini di utilizzo.