Gold Hourly Chart: The overnight close was relatively high, and today's Asian session continued its upward trend. The European session saw a sharp drop below the upper channel line at 4242. This trend resistance line is the same one that held pressure at 4218 in yesterday's European session. The market then closed with a large, plump, bearish candlestick pattern at 2:00 PM, reaching the target of 4210. Since it was a large bearish candlestick pattern, not a long lower shadow candlestick pattern, a rebound confirming the 5-day moving average at 4230-34 is sufficient, so a further downward push is warranted.
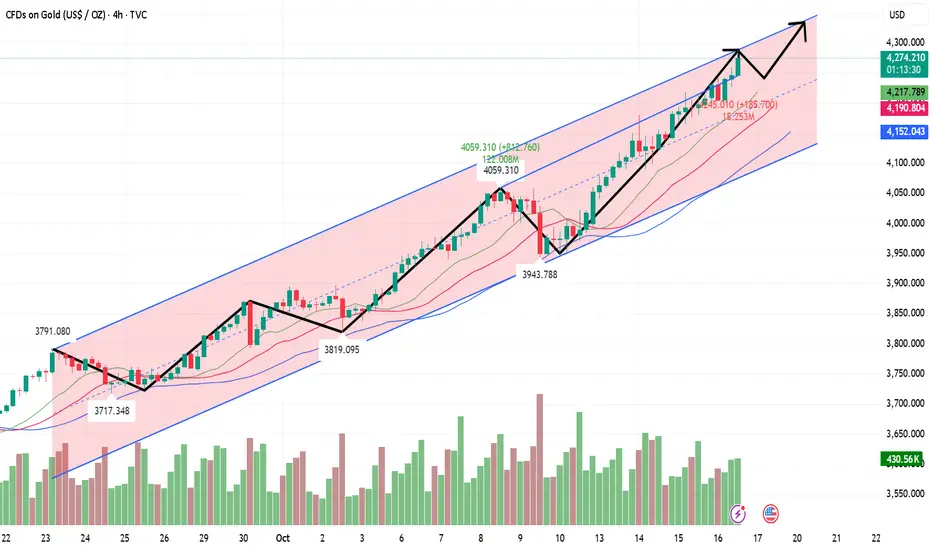
The European session saw consecutive positive days, testing the bottom and rallying to a new all-time high. However, caution is advised in the US session. On the one hand, the 4250 level is a resistance point in the channel, and on the other hand, it is nearing the end of an ascending converging triangle, leaving little room for further movement and a potential reversal. Therefore, support remains at the middle line at 4230. Only a significant break below this level would trigger a potential for a significant short-term correction. Resistance is at 4265. Be cautious about blindly chasing rallies below this level. Consider the gains and losses at both levels and wait for signals.
The European session saw consecutive positive days, testing the bottom and rallying to a new all-time high. However, caution is advised in the US session. On the one hand, the 4250 level is a resistance point in the channel, and on the other hand, it is nearing the end of an ascending converging triangle, leaving little room for further movement and a potential reversal. Therefore, support remains at the middle line at 4230. Only a significant break below this level would trigger a potential for a significant short-term correction. Resistance is at 4265. Be cautious about blindly chasing rallies below this level. Consider the gains and losses at both levels and wait for signals.
Trade attivo
Gold Short-Term Trading Strategy:BUY: 4240 Stop Loss: 4232-28 Target: 4260-70
SELL: 4275 Stop Loss: 4283-88 Target: 4250
The road to success is not crowded. As long as you choose the right direction and follow the right team, you will be able to move forward.
t.me/david_456654
t.me/david_456654
Pubblicazioni correlate
Declinazione di responsabilità
Le informazioni ed i contenuti pubblicati non costituiscono in alcun modo una sollecitazione ad investire o ad operare nei mercati finanziari. Non sono inoltre fornite o supportate da TradingView. Maggiori dettagli nelle Condizioni d'uso.