Market Analysis:
① The daily MACD is forming a golden cross at a high level with high volume and volatility, and the STO indicator is overbought, indicating a high-priced trend. A candlestick chart with a hanging line after consecutive long-term bullish candlesticks indicates high-priced volatility, with the risk of a pullback. This is unless another long-term bullish candlestick pattern breaks yesterday's hanging line.
Therefore, today's upside focus is on yesterday's high of 3895. A break above this level could push the price towards the 4000 mark.
Current daily support lies near the MA5 and MA10 moving averages, corresponding to support levels of 3837 and 3787. However, the MA10 moving average has no chance of success, so the main focus for the day is support at 3837. This means the intraday range remains between 3837 and 3895.
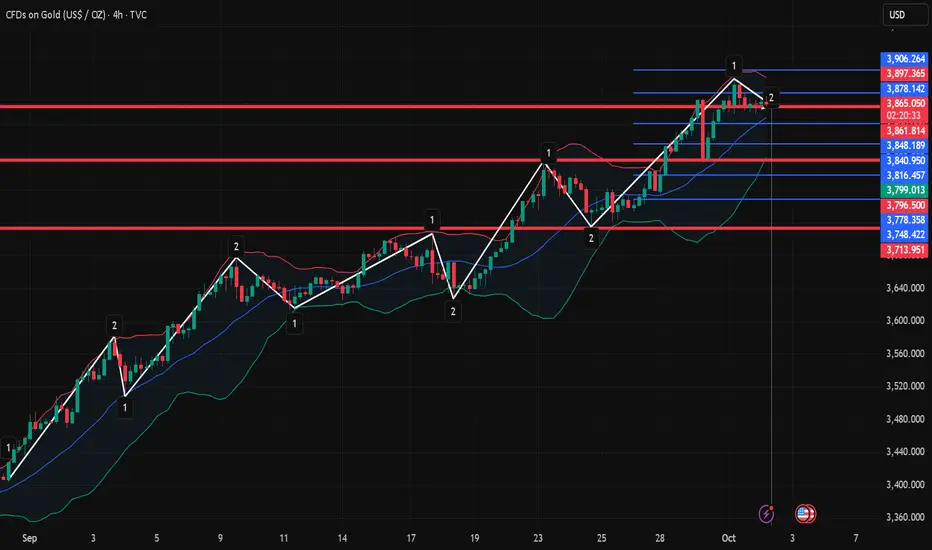
② The 4-hour MACD is forming a high-level death cross, and the STO indicator's fast line is showing an upward curve, indicating a volatile trend in the 4-hour chart. Short-term support in the 4-hour chart lies near the middle line at 3844, but this is expected to gradually move up to around 3850 over time. We observe that the three Bollinger Bands on the 4-hour chart are currently narrowing, indicating range-bound fluctuations. The upper band is currently holding pressure at 3901, but it will likely move down to around 3890-95 over time.
③ On the hourly chart, the three Bollinger Bands are also narrowing, with the lower band and the MA60 moving average currently supporting the 3852-54 level. If the price falls below 3852, a downward trend is likely.
① The daily MACD is forming a golden cross at a high level with high volume and volatility, and the STO indicator is overbought, indicating a high-priced trend. A candlestick chart with a hanging line after consecutive long-term bullish candlesticks indicates high-priced volatility, with the risk of a pullback. This is unless another long-term bullish candlestick pattern breaks yesterday's hanging line.
Therefore, today's upside focus is on yesterday's high of 3895. A break above this level could push the price towards the 4000 mark.
Current daily support lies near the MA5 and MA10 moving averages, corresponding to support levels of 3837 and 3787. However, the MA10 moving average has no chance of success, so the main focus for the day is support at 3837. This means the intraday range remains between 3837 and 3895.
② The 4-hour MACD is forming a high-level death cross, and the STO indicator's fast line is showing an upward curve, indicating a volatile trend in the 4-hour chart. Short-term support in the 4-hour chart lies near the middle line at 3844, but this is expected to gradually move up to around 3850 over time. We observe that the three Bollinger Bands on the 4-hour chart are currently narrowing, indicating range-bound fluctuations. The upper band is currently holding pressure at 3901, but it will likely move down to around 3890-95 over time.
③ On the hourly chart, the three Bollinger Bands are also narrowing, with the lower band and the MA60 moving average currently supporting the 3852-54 level. If the price falls below 3852, a downward trend is likely.
Trade attivo
Strategy:[1] Buy around 3855-56 before the European session, defend 3850, target 3865-3875-3885
[2] Buy around 3888-3890 above, defend 3897, target 3878-3868-3858
[3] Buy around 3832 and 3790 below, defend 6 more points around 3832, target 3850
The road to success is not crowded. As long as you choose the right direction and follow the right team, you will be able to move forward.
t.me/david_456654
t.me/david_456654
Pubblicazioni correlate
Declinazione di responsabilità
Le informazioni ed i contenuti pubblicati non costituiscono in alcun modo una sollecitazione ad investire o ad operare nei mercati finanziari. Non sono inoltre fornite o supportate da TradingView. Maggiori dettagli nelle Condizioni d'uso.