📈 GOLD (XAU/USD) – 1H Chart Technical Analysis
Date: August 4, 2025 | Timeframe: 1-Hour
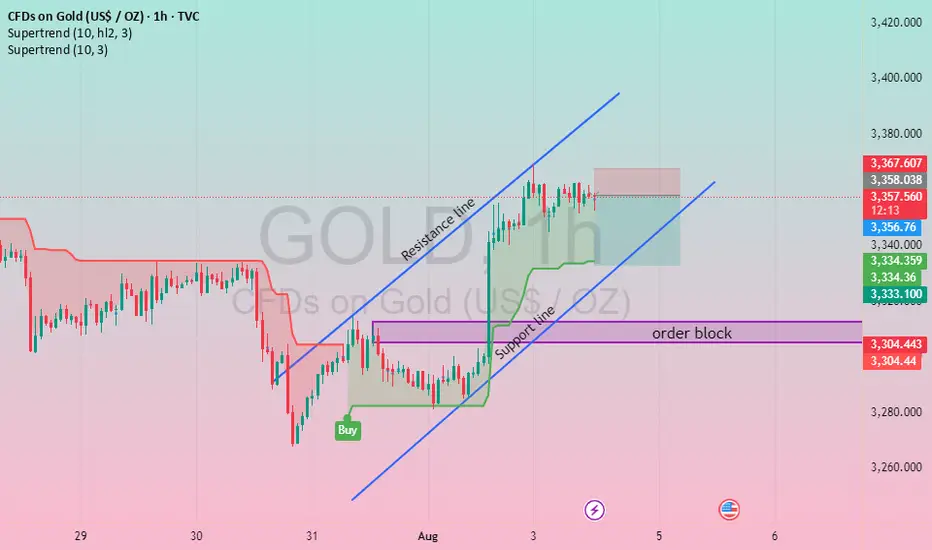
This chart presents a clear bullish structure on GOLD, indicating upward momentum following a significant reversal from a previous downtrend.
🔹 Key Technical Elements:
Ascending Channel:
The price is trading within an upward channel, bounded by a support line (lower blue trendline) and a resistance line (upper blue trendline).
This reflects a short-term bullish trend, with higher highs and higher lows.
Order Block Zone (Purple Box: $3,304 – $3,305):
This area represents a previous consolidation and institutional demand zone.
Price reacted strongly from this zone, confirming it as a valid support and buy zone.
Buy Entry Confirmation:
A buy label is placed at the breakout from the consolidation range, showing a bullish order flow initiation.
Supertrend Indicator:
The Supertrend is green, confirming bullish sentiment.
Current values: $3,334.36 and $3,334.359, acting as dynamic support.
Resistance Ahead:
The price is currently near a minor resistance (highlighted red zone), where a short-term pullback may occur before further continuation.
🔸 Possible Scenarios:
Bullish Continuation:
If price sustains above the support trendline and breaks the resistance zone near $3,367, we may see a move towards $3,400+.
Bearish Pullback:
If the price breaks below the support line and enters the order block, it could retest $3,304–$3,305 before rebounding or continuing down
Trade attivo
📉 SL Hit – Market Update on GOLD (XAU/USD)The buy setup failed as price rejected the resistance line of the rising channel around $3,370, showing strong bearish pressure at the top.
🔻 Price action formed a fake breakout (liquidity grab) above the recent high, and quickly reversed, triggering SL for long positions.
📊 Reasons for SL hit:
Price touched resistance line and failed to sustain above.
Possible manipulation near liquidity zone, trapping breakout buyers.
Supertrend indicator is also showing a potential reversal zone.
Price may now retest the order block (demand zone) around $3,304.
📌 What’s next?
Wait for a strong bullish rejection from the order block or a breakout above the resistance line for a valid re-entry signal
Trade chiuso: stop raggiunto
Declinazione di responsabilità
Le informazioni ed i contenuti pubblicati non costituiscono in alcun modo una sollecitazione ad investire o ad operare nei mercati finanziari. Non sono inoltre fornite o supportate da TradingView. Maggiori dettagli nelle Condizioni d'uso.
Declinazione di responsabilità
Le informazioni ed i contenuti pubblicati non costituiscono in alcun modo una sollecitazione ad investire o ad operare nei mercati finanziari. Non sono inoltre fornite o supportate da TradingView. Maggiori dettagli nelle Condizioni d'uso.
