Gold Technical analysis
###🔍 **Overall Chart Context**
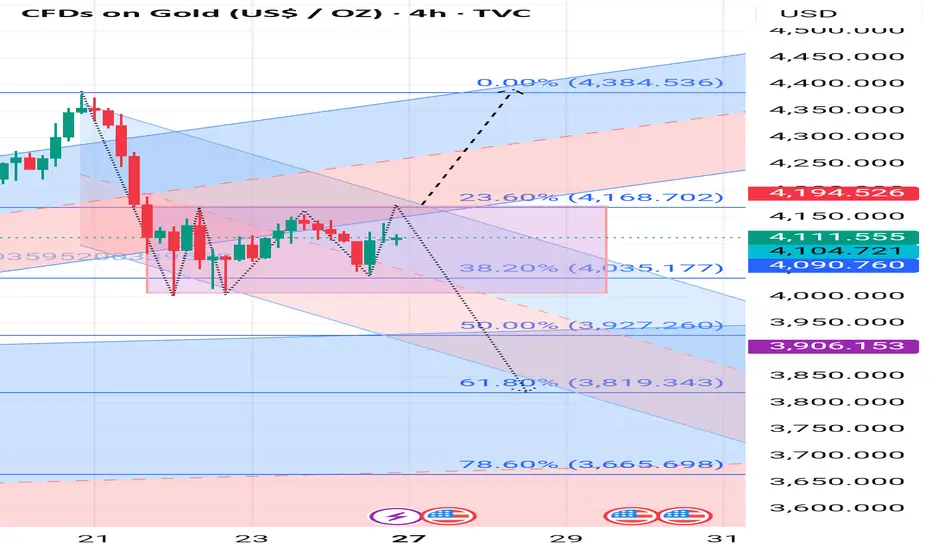
* The chart shows a **downward correction** after a recent swing high near **$4,384.536**.
* The current price is around **$4,111.55 USD/oz**, moving sideways within a **rectangular consolidation zone** (highlighted in pink).
* The **Fibonacci retracement tool** is drawn from the recent swing low to the swing high, showing potential retracement levels where price might react.
---
### 📉 **Fibonacci Levels and Key Zones**
| Fibonacci Level | Price Zone (USD) | Technical Meaning |
| --------------- | ---------------- | ------------------------------------------- |
| 23.6% | 4,168.702 | First minor resistance in a corrective move |
| 38.2% | 4,035.177 | Short-term support; currently being tested |
| 50.0% | 3,927.260 | Intermediate support (often key pivot) |
| 61.8% | 3,819.343 | Strong golden-ratio support zone |
| 78.6% | 3,665.698 | Deep retracement; could trigger reversal |
---
### 🧭 **Key Support and Resistance Levels**
**Resistance Levels:**
1. **$4,168 – $4,195** → 23.6% Fibonacci + upper channel zone; major resistance area.
2. **$4,384** → Recent swing high and strong structural resistance.
**Support Levels:**
1. **$4,035 – $4,090** → Current range bottom; 38.2% Fibonacci level.
2. **$3,927** → 50% retracement and midpoint of the trend channel.
3. **$3,819** → 61.8% Fibonacci (golden zone) — strong potential rebound area.
4. **$3,665** → Final major support; if broken, trend may turn fully bearish.
---
### 📊 **Current Price Action**
* Gold is **consolidating sideways** within a rectangular box between **$4,035 – $4,168**, showing **indecision** before the next major move.
* The candles indicate **buying pressure near the bottom** and **selling pressure near the top** of the box.
* The trend channel (red and blue parallel zones) indicates **bearish momentum dominance** in the short term.
---
### 🔮 **Forecast (Next Move Outlook)**
**📈 Bullish Scenario:**
* If price **breaks above $4,170 – $4,195** with strong volume, next targets:
* **$4,250**, then **$4,384** (previous swing high).
* Momentum would shift toward a recovery rally.
**📉 Bearish Scenario:**
* If price **breaks below $4,035**, expect:
* First drop toward **$3,927 (50% Fib)**, then **$3,819 (61.8%)**.
* A sustained move below **$3,819** may confirm a **bearish continuation** targeting **$3,665**.
**🎯 Neutral / Range-Bound:**
* Until a clear breakout occurs, Gold may **oscillate between $4,035 and $4,170**, forming a **consolidation base** before the next directional move.
---
### 🧠 **Summary**
| Trend | Status |
| -------------- | -------------------------------------------------------------------------------------------------- |
| Short-Term | Sideways / Consolidating |
| Medium-Term | Bearish bias below $4,170 |
| Key Support | $4,035 / $3,927 / $3,819 |
| Key Resistance | $4,168 / $4,195 / $4,384 |
| Forecast | Possible drop toward $3,927–$3,819 if $4,035 breaks; bullish breakout above $4,195 targets $4,384+ |
---
###🔍 **Overall Chart Context**
* The chart shows a **downward correction** after a recent swing high near **$4,384.536**.
* The current price is around **$4,111.55 USD/oz**, moving sideways within a **rectangular consolidation zone** (highlighted in pink).
* The **Fibonacci retracement tool** is drawn from the recent swing low to the swing high, showing potential retracement levels where price might react.
---
### 📉 **Fibonacci Levels and Key Zones**
| Fibonacci Level | Price Zone (USD) | Technical Meaning |
| --------------- | ---------------- | ------------------------------------------- |
| 23.6% | 4,168.702 | First minor resistance in a corrective move |
| 38.2% | 4,035.177 | Short-term support; currently being tested |
| 50.0% | 3,927.260 | Intermediate support (often key pivot) |
| 61.8% | 3,819.343 | Strong golden-ratio support zone |
| 78.6% | 3,665.698 | Deep retracement; could trigger reversal |
---
### 🧭 **Key Support and Resistance Levels**
**Resistance Levels:**
1. **$4,168 – $4,195** → 23.6% Fibonacci + upper channel zone; major resistance area.
2. **$4,384** → Recent swing high and strong structural resistance.
**Support Levels:**
1. **$4,035 – $4,090** → Current range bottom; 38.2% Fibonacci level.
2. **$3,927** → 50% retracement and midpoint of the trend channel.
3. **$3,819** → 61.8% Fibonacci (golden zone) — strong potential rebound area.
4. **$3,665** → Final major support; if broken, trend may turn fully bearish.
---
### 📊 **Current Price Action**
* Gold is **consolidating sideways** within a rectangular box between **$4,035 – $4,168**, showing **indecision** before the next major move.
* The candles indicate **buying pressure near the bottom** and **selling pressure near the top** of the box.
* The trend channel (red and blue parallel zones) indicates **bearish momentum dominance** in the short term.
---
### 🔮 **Forecast (Next Move Outlook)**
**📈 Bullish Scenario:**
* If price **breaks above $4,170 – $4,195** with strong volume, next targets:
* **$4,250**, then **$4,384** (previous swing high).
* Momentum would shift toward a recovery rally.
**📉 Bearish Scenario:**
* If price **breaks below $4,035**, expect:
* First drop toward **$3,927 (50% Fib)**, then **$3,819 (61.8%)**.
* A sustained move below **$3,819** may confirm a **bearish continuation** targeting **$3,665**.
**🎯 Neutral / Range-Bound:**
* Until a clear breakout occurs, Gold may **oscillate between $4,035 and $4,170**, forming a **consolidation base** before the next directional move.
---
### 🧠 **Summary**
| Trend | Status |
| -------------- | -------------------------------------------------------------------------------------------------- |
| Short-Term | Sideways / Consolidating |
| Medium-Term | Bearish bias below $4,170 |
| Key Support | $4,035 / $3,927 / $3,819 |
| Key Resistance | $4,168 / $4,195 / $4,384 |
| Forecast | Possible drop toward $3,927–$3,819 if $4,035 breaks; bullish breakout above $4,195 targets $4,384+ |
---
Declinazione di responsabilità
Le informazioni ed i contenuti pubblicati non costituiscono in alcun modo una sollecitazione ad investire o ad operare nei mercati finanziari. Non sono inoltre fornite o supportate da TradingView. Maggiori dettagli nelle Condizioni d'uso.
Declinazione di responsabilità
Le informazioni ed i contenuti pubblicati non costituiscono in alcun modo una sollecitazione ad investire o ad operare nei mercati finanziari. Non sono inoltre fornite o supportate da TradingView. Maggiori dettagli nelle Condizioni d'uso.