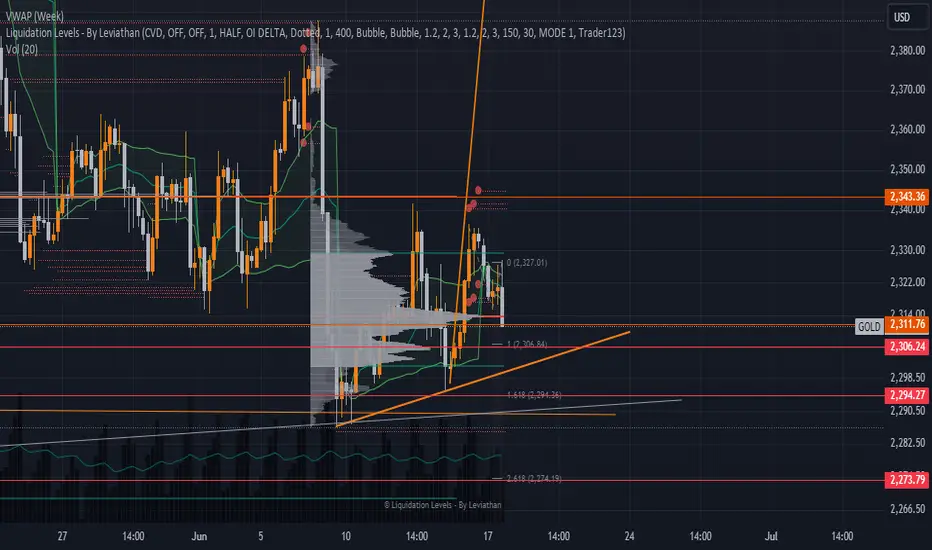
Gold (GOLD/USD) with various technical indicators and levels marked on it. Here’s an analysis based on the chart provided:
Key Observations:
Price Levels:
Current Price: 2,311.76 USD
Major Support: Around 2,294.27 USD and 2,273.79 USD
Major Resistance: Around 2,343.36 USD
Fibonacci Levels:
1.0 Retracement: 2,306.84 USD
1.618 Extension: 2,294.36 USD
2.618 Extension: 2,274.19 USD
VWAP (Volume Weighted Average Price):
Weekly VWAP: 2,321.00 USD
Volume Profile:
Shows significant trading volume and price acceptance around the 2,294 USD to 2,306 USD range.
Trend Lines:
Upward sloping orange trend lines indicate a potential ascending support level.
Projected Move:
An orange projection indicates a potential sharp upward movement targeting the 2,343.36 USD level.
Analysis:
Support and Resistance:
The current price is slightly below the weekly VWAP, indicating potential resistance around the 2,321.00 USD level.
Immediate support is found at the 2,306.24 USD level, which aligns with the 1.0 Fibonacci retracement.
Strong support is expected around 2,294.27 USD, indicated by both the 1.618 Fibonacci extension and volume profile.
On the upside, significant resistance is expected around 2,343.36 USD, which is a key level marked on the chart.
Fibonacci Retracement and Extension:
The price needs to hold above the 1.0 Fibonacci retracement level (2,306.84 USD) to confirm a bullish trend.
Below this, the 1.618 extension (2,294.36 USD) and 2.618 extension (2,274.19 USD) provide deeper support levels.
VWAP Analysis:
Trading slightly below the weekly VWAP suggests some bearish pressure, but a move above this level could shift the bias to bullish.
Volume Profile:
The highest trading volume and price acceptance occur between 2,294 USD and 2,306 USD, indicating this range as a critical support zone.
Trend Lines:
The ascending trend lines suggest an upward momentum, with the price finding support on these lines in case of a pullback.
Projected Move:
The sharp upward projection suggests that if the price holds above the current support levels and gains momentum, a rapid move towards the 2,343.36 USD resistance is possible.
Strategy:
For Bulls:
Look for long entries around the current support at 2,306.24 USD with a tight stop loss below 2,294.27 USD.
Target the 2,321.00 USD level initially, with a potential extension towards 2,343.36 USD.
Monitor price action around key resistance levels for potential profit-taking or further continuation.
For Bears:
Watch for a breakdown below 2,294.27 USD for potential short entries, targeting lower support levels around 2,274.19 USD.
Alternatively, consider short positions around the 2,343.36 USD resistance if the price shows signs of reversal.
Conclusion:
The chart indicates a potential bullish scenario if the current support levels hold, with targets towards 2,343.36 USD. Traders should watch key levels and volume profile zones for confirmation and manage risk accordingly.
Declinazione di responsabilità
Le informazioni ed i contenuti pubblicati non costituiscono in alcun modo una sollecitazione ad investire o ad operare nei mercati finanziari. Non sono inoltre fornite o supportate da TradingView. Maggiori dettagli nelle Condizioni d'uso.
Declinazione di responsabilità
Le informazioni ed i contenuti pubblicati non costituiscono in alcun modo una sollecitazione ad investire o ad operare nei mercati finanziari. Non sono inoltre fornite o supportate da TradingView. Maggiori dettagli nelle Condizioni d'uso.